Publication ID: A4192-011
Introduction
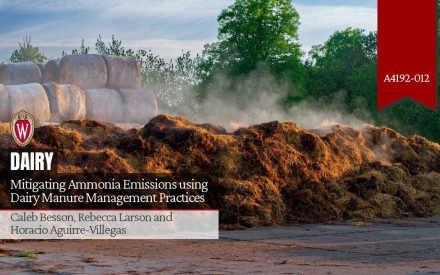
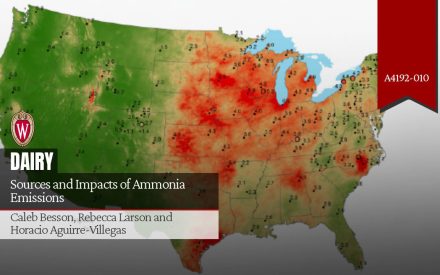
Ammonia emissions released to the atmosphere present environmental and human health concerns (see “Sources and Impacts of Ammonia Emissions”, Besson, Aguirre-Villegas, and Larson 2022a). Agriculture is the leading contributor to ammonia emissions in the U.S. (U.S. EPA 2021). Understanding the sources of ammonia emissions from dairy farms helps to establish baselines of current emission levels and identify management and mitigation strategies. This factsheet presents a summary of ammonia emissions from manure management in Wisconsin’s conventional, organic, and grazing dairy systems. Differentiating among farm types allows for evaluation and management of ammonia emissions in varying farm systems that can differ in layout characteristics such as herd composition, diet management, and manure management. Assessment of ammonia losses from these systems allows producers to adopt management and mitigation practices most relevant to their individual circumstances. Finally, the way modeling results are presented can have an impact on emissions intensity. Results are presented using different metrics (denominators of manure excreted, milk production, and animal units) to present differences in ammonia emission intensity based on methodology
Farm Systems Modeled
Five conventional farms, five organic farms, and three grazing farms, each having distinct characteristics, were modeled using a variety of data sources to assess ammonia emissions in varying circumstances. The farms were selected to capture the range of practices adopted at dairy operations in Wisconsin and relate these practices to ammonia emissions using equations and emission factors (Rotz et al. 2018; IPCC 2019; Jokela et al. 2020). Farms are identified by size, animal breed (if different from Holsteins), manure solids content (solid, slurry, or liquid), and other distinctive characteristics. For example, farms that have intensive grazing (grazing) and farms that are not connected to the electricity grid (off-grid) (Table 1).
Table 1. Modeled farm characteristics
| ID | Farm Size | Manure Type | Number of Lactating Cows | Percent of Manure Collected | Manure Storage | |||
|---|---|---|---|---|---|---|---|---|
| Conv. | C1 | Small | Slurry | 50 | 100 | Storage with crust | ||
| C2 | Medium | Slurry | 200 | |||||
| C3 | Large | Slurry | 1,000 | |||||
| C4 | Small | Solid | 50 | Solid stack | ||||
| C5 | Large | Liquid | 1,000 | Storage without crust | ||||
| Number of Lactating Cows | Percent of Diet as Pasturea | Non-grazing | Grazing | |||||
| Organic | O1 | Small | Solid | 50 (Jerseys) | 55–70 | 90 | 35 | Solid stack |
| O2 | Small | Solid | 50 | 55–70 | 35 | Solid stack | ||
| O3 | Medium | Slurry | 150 | 35–60 | 50 | Storage with crust | ||
| O4 | Small | Solid (grazing) | 50 | 80 | 10 | Bedded pack | ||
| O5 | Small | Solid (off-grid) | 50 | 55–70 | 35 | |||
| Grazing | G1 | Small | Solid | 50 | 62b | 100 | 50 | Solid stack |
| G2 | Medium | Slurry | 200 | 62b | Storage with crust | |||
| G3 | Large | Slurry | 1,000 | 62b | ||||
Herd Composition and Milk Production
Herd composition for each farm is represented by the number of lactating cows, but also includes the heifers and dry cows needed to maintain those lactating cows and provide a constant milk production level. All scenarios assume Holstein cows aside from O1, which models Jersey cows producing milk with a higher fat (4.5%) and protein (3.5%) content than Holstein cows (fat 3.8% and protein 3.15%). The fat and protein content in the milk are among the main nutritional and valued components in milk and therefore, tracking these components is important to make relevant comparisons. For this analysis milk production is adjusted to 4% fat and 3.3% protein (known as fat and protein corrected milk (FPCM)) to express ammonia emissions intensity consistently among farms.
Diet Management
Different farms feed unique animal diets. Diets are composed of pasture, forages, grains, and supplements to provide balanced nutrition. Conventional farms tend to use more grains and supplements to maximize milk production. USDA certified organic farms require that cows be fed diets produced without synthetic pesticides and fertilizers commonly used on conventional farms (USDA 2001). These organic guidelines also require that cows have access to pasture for at least six months of the year. As a result, organic farms have a more complicated diet scheme than conventional farms due to differences between grazing and non-grazing seasons, which are unique for each farm. Grazing farms also include both grazing and non-grazing diets for cows; however, they do not have to follow the same feed standard guidelines as organic farms and can use components similar to conventional farm diets during the non-grazing season. All grazing farms modeled in this assessment have grazing periods of six months, except for the large farm (G3) that uses pasture as a feeding component for three months a year.
Manure Management
Manure can be stored as a solid, slurry, or liquid. In general, smaller farms tend to manage either solid or slurry manure, while larger conventional farms manage slurry or liquid manure (Bollwahn 2014; Aguirre-Villegas and Larson 2017). When cows are not grazing in any type of farm, manure is modeled in three processes, collection, storage, and land application. During the grazing season (three to six months of the year), manure is excreted directly on pasture, with 10 to 50% of the manure collected (Table 1). Ammonia emissions differ when manure is directly excreted on pasture versus when manure is managed with collection, storage, and land application, which is accounted for in the model.
Solid manure in this assessment is stacked and land applied two times a year. Slurry and liquid manure are stored in a storage structure for approximately six months. Slurry manure promotes formation of a natural crust on top of the stored manure due to the higher solids content compared to liquid manure which does not form a crust during storage. The crust acts as a natural cover and reduces exposure to wind, reducing ammonia loss (Aguerre, Wattiaux, and Powell 2012). Also affecting emissions from storage are the pH, surface area, and ambient temperature. All farm layouts in this assessment land-apply manure two times per year (spring and fall) with the model accounting for corresponding ammonia emissions from surface application (Jokela et al. 2020). None of the modeled farms incorporate manure processing which is discussed in the companion fact sheet (Besson, Aguirre-Villegas, and Larson 2022b) along with alternative manure management practices to reduce ammonia emissions.
Modeling
The model used to obtain the results presented below combines real farm management data, data from previous studies, and surveys of dairy farms in Wisconsin, the Great Lakes region, and the U.S. This information includes farm layouts, practices, and farm characteristics for conventional farms (Ferraretto 2022; Aguirre-Villegas et al. 2015), organic farms (AguirreVillegas et al. 2022), and grazing farms (Aguirre-Villegas et al. 2017). For farms with grazing components, the model evaluated grazing and non-grazing seasons separately to better capture the effect of on-farm practices and their relationship to ammonia emissions.
Ammonia emissions from manure for each farm layout were estimated using three steps. Equations from the Integrated Farm System Model (IFSM) were used to predict emissions in the barn and during storage (Rotz et al. 2018). IFSM is a process-based model that relates key practices and manure characteristics to ammonia emissions (e.g., manure pH, ammoniacal nitrogen content in manure, crust formation on top of the storage, manure type, etc.). Emission factors for ammonia from the Intergovernmental Panel on Climate Change (IPCC 2019) were used for manure excreted directly on pasture. The emission factors are specific to dairy production and capture the effect of manure 3 management practice and temperature. Finally, a model for emissions from manure after land application (Jokela et al. 2020) relates emissions to the content of total solids in manure and the timing of manure incorporation or injection.
Models and experimental data can be used to understand the source and magnitude of ammonia emissions as well as make decisions on management practices that minimize ammonia losses. Management practices such as composting, increased milk production, or diet modifications for example, can be modeled to assess their impact on emission losses from an entire system (IPCC 2019). The modeled emissions from a system with and without the selected management practice can provide information on the impact of integrating this practice. This can be used to compare various management practices for one system before investing in the technology or practice.
Ammonia Emission Results
Results for the 13 modeled farms are presented (Figure 1) with relative emissions from each step of the manure management process in 1,000 pounds of ammonia lost per ton of excreted manure. Farm size and breed both had little effect on ammonia emissions. Differences in emissions in C1, C2, and C3 which are all farms managing slurry or liquid manure and differ in herd size, are a result of differing practices on each farm. Differences in breed result in a small overall difference in ammonia emissions, highlighted in the comparison of O1 (Jersey) and O2 (Holstein). Housing emissions cause the difference between the two scenarios, where Holstein cows emit slightly less ammonia than Jersey cows in the barn. This difference can be attributed to presenting results per unit of excreted manure. Though Jersey cows have less ammonia emissions per cow than Holsteins, Jersey cows also excrete less manure and have a lower urine to feces ratio than Holsteins, inflating their ammonia emissions when we view results in ammonia emissions per excreted manure (Uddin and Wattiaux 2021).
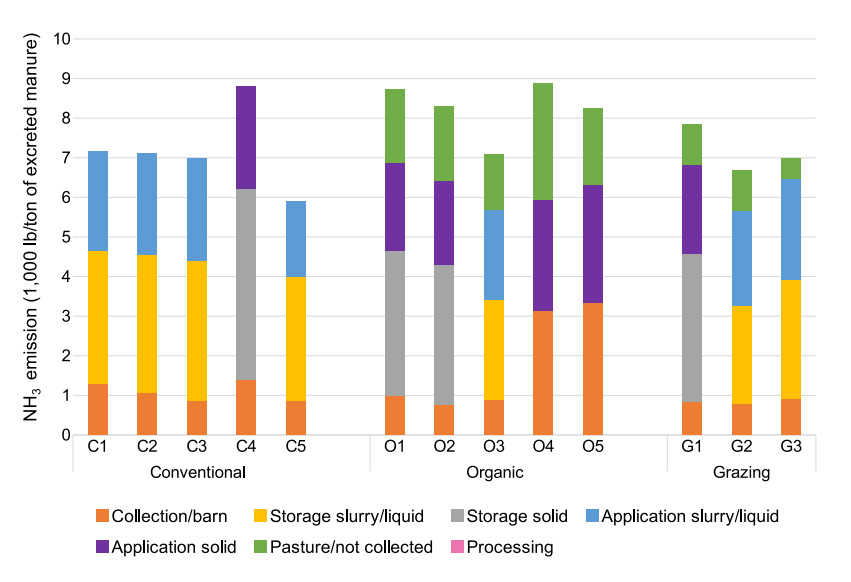
Lowest emissions of the modeled farm systems occur in the largest conventional farm modeled (C5) with liquid manure storage (Figure 1). Liquid manure storage reduces emissions compared to solids storage due to the reduction in pH. The lower pH in liquid manure storage results in lower ammonia emissions despite a larger surface area of the stored manure (Rotz et al. 2018).
During land application, all scenarios consider that manure is surface applied (although this is known to increase ammonia emissions compared to other land application methods). As liquid manure has a lower total solids content it more easily infiltrates into the soil, avoiding exposure to the atmosphere and reducing ammonia volatilization. Ammonia emissions from land application are comparable to each other for each manure type despite the lower infiltration rate of solid manure compared to liquid and slurry. This lack of difference is explained by larger nitrogen losses during solid manure storage when compared to liquid manure storage, leaving less ammoniacal nitrogen available to be lost as ammonia after manure land application.
In organic and grazing farms, ammonia emissions come partially from manure deposited on pasture during grazing (Figure 1). These emissions are directly related to the time that cows spend grazing, thus, the amount of manure that is deposited on pastures. For example, the large grazing farm shows lower emissions from manure excreted directly on pasture due to a shortened grazing season of only three months. Another factor in emissions from manure in pasture is the collection rate during grazing. It is assumed that organic small grazing farms (O4) have a collection rate of only Figure 1. Ammonia emissions from the 13 modeled farms. 4 10% of manure during grazing while the organic medium farm (O3) has a collection rate of 50% and less ammonia emissions from pasture and overall.
Most notably, emissions across farm types and farm sizes are primarily resultant from storage and application of manure, with emission from manure in pasture as another primary source in organic and grazing situations.
Trends in Emissions Based on Presentation of Results
Ammonia emissions have been presented in 1,000 pounds of ammonia per ton of excreted manure. This denominator (tons of excreted manure) was selected to relate ammonia emissions to manure management strategies. Emissions can be expressed in many units relating to production of milk, management of manure, size of the farm, or other relevant farm units. In this model, emissions are also expressed per unit of produced milk, given that is the main objective of a dairy farm. Another denominator used is the number of animal units (1 animal unit (AU) = 1,000 pounds of animal). Changing these denominators can modify the trends of emissions between each farm layout and allows for comparison of relative emissions rankings when examined in these different circumstances (Figure 2).
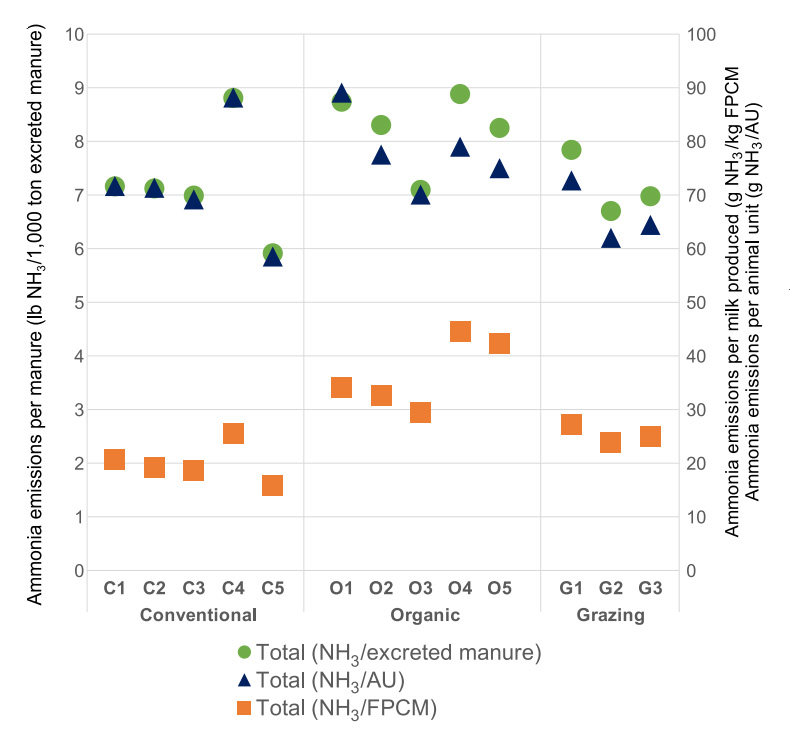
excreted manure, fat-and-protein corrected milk (FPCM), or animal units (AU).
The relative trends are similar when using different denominators. However, when comparing across farm types using fat-and protein corrected milk (FPCM) as the denominator, organic farms emit more ammonia (per FPCM) than conventional and grazing farms as milk production is generally lower in organic farms. When the denominator of excreted manure is used, organic farms are comparable in emission with grazing and conventional farms (Figure 2). This change highlights the importance of the selection of the units under which results are evaluated. Ideally, multiple dominators are evaluated to examine trends and assess various objectives using the most relevant denominator.
Summary
The focus of this study is to quantify ammonia emissions from typical manure management practices on conventional, organic, and grazing dairy farms in Wisconsin. Ammonia emissions from manure were estimated for 13 farms by using process-based modeling via equations from models and emission factors. Quantifying emissions for different dairy systems help identify where management practices can be used to reduce ammonia losses specific to that system. Results presented per excreted manure show that the largest contributors to ammonia emissions include manure storage of all types, with solid storage having higher emissions than slurry or liquid. Application of solid, liquid, and slurry manure also results in large ammonia emissions, and all are comparable in intensity. Presenting emission results per produced FPCM show highest emissions with organic dairy followed by grazing and then conventional with the lowest, whereas presenting emission results per excreted manure show all farm types as being comparable in emissions, underscoring the importance of how data are presented. Understanding the sources of emissions in different farm management systems allows us to better identify areas for improvement to mitigate missions. The Figure 2. Comparison of ammonia (NH₃) emissions intensity when the denominator is excreted manure, fat-and-protein corrected milk (FPCM), or animal units (AU). 5 purpose of this study was not to recommend a specific farm system, as there are many metrics that compose a farms sustainability, but to identify areas for mitigation. This model can also be used to assess various mitigation practices by farm types to guide practice implementation, that can be found in the next fact sheet within the series “Mitigating Ammonia Emissions using Dairy Manure Management Practices” (Besson, Aguirre-Villegas, and Larson 2022b).
References
- Aguerre, M. J., M. A. Wattiaux, and J. M. Powell. 2012. “Emissions of Ammonia, Nitrous Oxide, Methane, and Carbon Dioxide during Storage of Dairy Cow Manure as Affected by Dietary Forage-to-Concentrate Ratio and Crust Formation.” Journal of Dairy Science 95(12):7409–16. https://doi.org/10.3168/jds.2012-5340
- Aguirre-Villegas, H. A., and R. A. Larson. 2017. “Evaluating Greenhouse Gas Emissions from Dairy Manure Management Practices Using Survey Data and Lifecycle Tools.” Journal of Cleaner Production 143:169–79. https://doi.org/10.1016/j.jclepro.2016.12.133
- Aguirre-Villegas, H. A., R. A. Larson, N. Rakobitsch, M. A. Wattiaux, and E. Silva. 2022. “Farm Level Environmental Assessment of Organic Dairy Systems in the U.S.” Journal of Cleaner Production 363. https://doi.org/10.1016/j.jclepro.2022.132390
- Aguirre-Villegas, H. A., T. H. Passos-Fonseca, D. J. Reinemann, L. E. Armentano, M. A. Wattiaux, V. E. Cabrera, J. M. Norman, and R. A. Larson. 2015. “Green Cheese: Partial Life Cycle Assessment of Greenhouse Gas Emissions and Energy Intensity of Integrated Dairy Production and Bioenergy Systems.” Journal of Dairy Science 98(3):1571–92. https://doi.org/10.3168/jds.2014-8850
- Aguirre-Villegas, H. A., T. H. Passos-Fonseca, D. J. Reinemann, and R. A. Larson. 2017. “Grazing Intensity Affects the Environmental Impact of Dairy Systems.” Journal of Dairy Science 100(8):6804–21. https://doi.org/10.3168/jds.2016-12325
- Besson, C. R., H. A. Aguirre-Villegas, and R. A. Larson. 2022a. “Sources and Impacts of Ammonia Emissions.” Manure Processing for Farm Sustainability Series UW Extension A4192-010. https://cdn.shopify.com/s/files/1/0145/8808/4272/files/A4192-010.pdf
- Besson, C. R., H. A. Aguirre-Villegas, and R. A. Larson. 2022b. “Mitigating Ammonia Emissions Using Dairy Manure Management Practices.” Manure Processing for Farm Sustainability Series UW Extension A4192-012.
- Bollwahn, S. 2014. “Storing Manure on Small Farms – Deciding on a Storage Option.” Michigan State University Extension. https://www.canr.msu.edu/news/storing_manure_on_small_farms_deciding_on_a_storage_option
- Ferraretto, L. 2022. “Ingredient Composition of the Experimental Diet.” Unpublished Data. Madison, Wisconsin.
- IPCC, Intergovernmental Panel on Climate Change. 2019. “2019 Refinement to the 2006 IPCC Guidelines for National Greenhouse Gas Inventories: Chapter 10: Emissions from Livestock and Manure Management.” Kyoto, Japan. https://www.ipcc-nggip.iges.or.jp/public/2019rf/pdf/4_Volume4/19R_V4_Ch10_Livestock.pdf
- Jokela, B., F. Magdoff, R. Bartlett, S. Bosworth, D. Ross, J. Tilley, H. Darby, J. Carter, K. Workman, and L. Ruhl. 2020. “Nutrient Recommendations for Field Crops in Vermont.” University of Vermont Extension BR. 1390.3. https://dec.vermont.gov/sites/dec/files/wmp/residual/UVM%20nutrient-recommendations-2017.pdf
- Rotz, C. A., M. S. Corson, D. S. Chianese, F. Montes, S. D. Hafner, H. F. Bonifacio, and C. U. Coiner. 2018. “The Integrated Farm System Model.” Agricultural Research Service: United States Department of Agriculture.
- Uddin, M. E., and M. A. Wattiaux. 2021. “Effect of Source and Level of Forage in the Diet on in Vitro Ammonia Emission from Manure of Holstein and Jersey Dairy Cows.” JDS Communications 2(1):16–20. https://doi.org/10.3168/jdsc.2020-0012
- U.S. EPA. 2021. “2017 NEI Data.” U.S. E.P.A.: Air Emissions Inventories. 2021. https://enviro.epa.gov/envirofacts/embed/nei?pType=SECTOR&pReport=nation&pState=&pPollutant=NH3&pYear=2017&pWho=NEI
- USDA, U.S. Department of Agriculture. 2001. Allowed and Prohibited Substances, Methods, and Ingredients in Organic Production and Handling. Code of Federal Regulations. United States: 65 FR 80637. https://www.ecfr.gov/current/title-7/subtitle-B/chapter-I/subchapter-M/part-205/subpart-B/section-205.105
Originally Published: January 12, 2022
Reviewers:
- Laura Paletta – Agriculture and Water Quality Outreach Specialist for Brown County
- Carl Duley – Professor and Agriculture Educator for the Buffalo County, both at the University of Wisconsin-Madison Division of Extension
- Michel Wattiaux – Professor for the Department of Animal and Dairy Sciences at the University of Wisconsin-Madison
Authors:
- Caleb Besson, Graduate Research Assistant, Biological Systems Engineering, University of Wisconsin–Madison
- Rebecca Larson, Associate Professor, Nelson Institute for Environmental Studies, University of Wisconsin–Madison
- Horacio Aguierre-Villegas, Scientist III, Nelson Institute for Environmental Studies, University of Wisconsin–Madison