Publication ID: A4192-010
What is Ammonia?
Ammonia (NH₃) is a colorless gas with a distinct odor released naturally during the breakdown of organic matter (U.S. EPA 2017). Ammonia is produced from natural processes and can also be manufactured for a variety of end uses. The most common end use is fertilizer. Gaseous ammonia naturally occurs at standard atmospheric pressure (normal ambient conditions). Under higher pressure, ammonia exists in liquid form, vaporizing as pressure decreases.
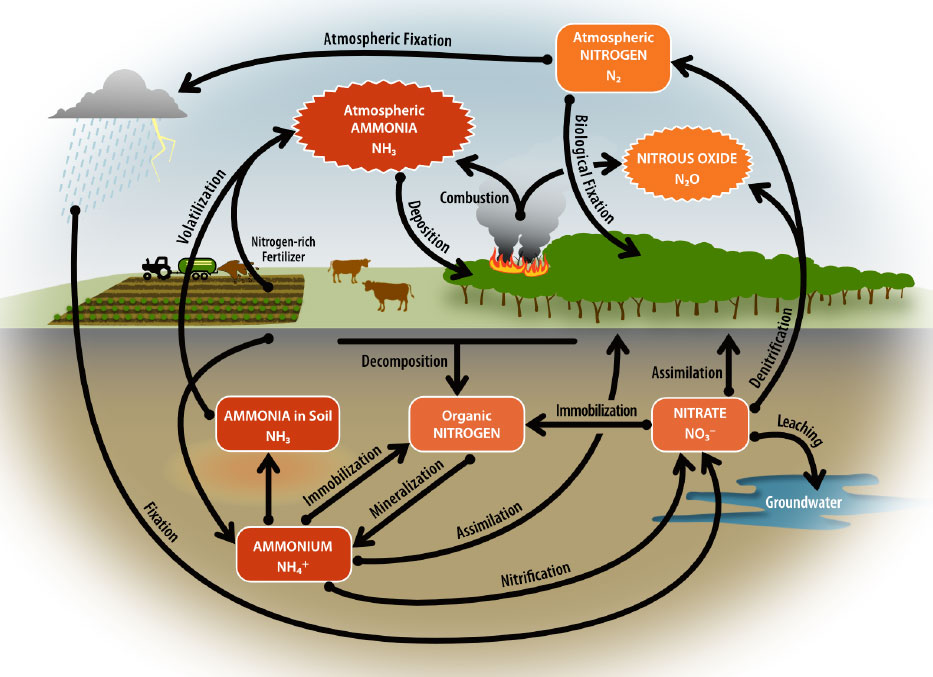
Ammonia is a natural component of the nitrogen cycle (Figure 1). Nitrogen found in plant organic matter, such as leaves, and crop residues can be transformed to ammonium through a process called mineralization. Urea, coming from feces and urine, can also be hydrolyzed, and converted into ammonium. If not used by plants or other biological processes, ammonium can be transformed into ammonia and volatilized or released into the atmosphere as a gas. Volatilization of ammonium to ammonia increases at pH levels above 8, and in moist and warm environments (Killpack and Buchholz 1993).
Villegas, Ruark, and Larson 2018; Aguirre-Villegas, Larson, and Ruark 2018.
Sources of Ammonia Emissions
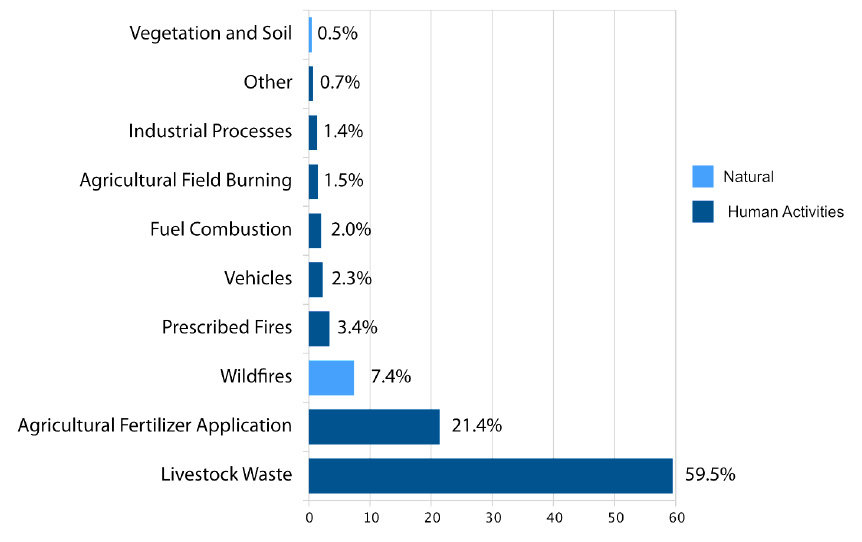
Ammonia can be emitted from natural and human activities (Figure 2). In the U.S., human activities such as fuel combustion and agricultural fertilizer application, are responsible for 80 to 92% of emissions while natural sources, such as wildfires, make up 8 to 20% (Behera et al. 2013; U.S. EPA 2021). Natural sources of ammonia, in order of magnitude of contribution, include wildfires, vegetation, and soils not managed for agricultural products (U.S. EPA 2021). Vegetation can emit and absorb ammonia depending on equilibrium with the surrounding air. In addition, all living organisms emit ammonia, including humans. Forest and grassland fires also emit a significant amount of ammonia resulting from both natural and human activities (Behera et al. 2013). Ammonia emissions from human activities are larger than emissions from natural sources. Approximately 80% of total ammonia emissions in the U.S. are from agricultural sources including both fertilizer application and animal manure (Figure 2).
Trends in Ammonia Emissions and Concentrations
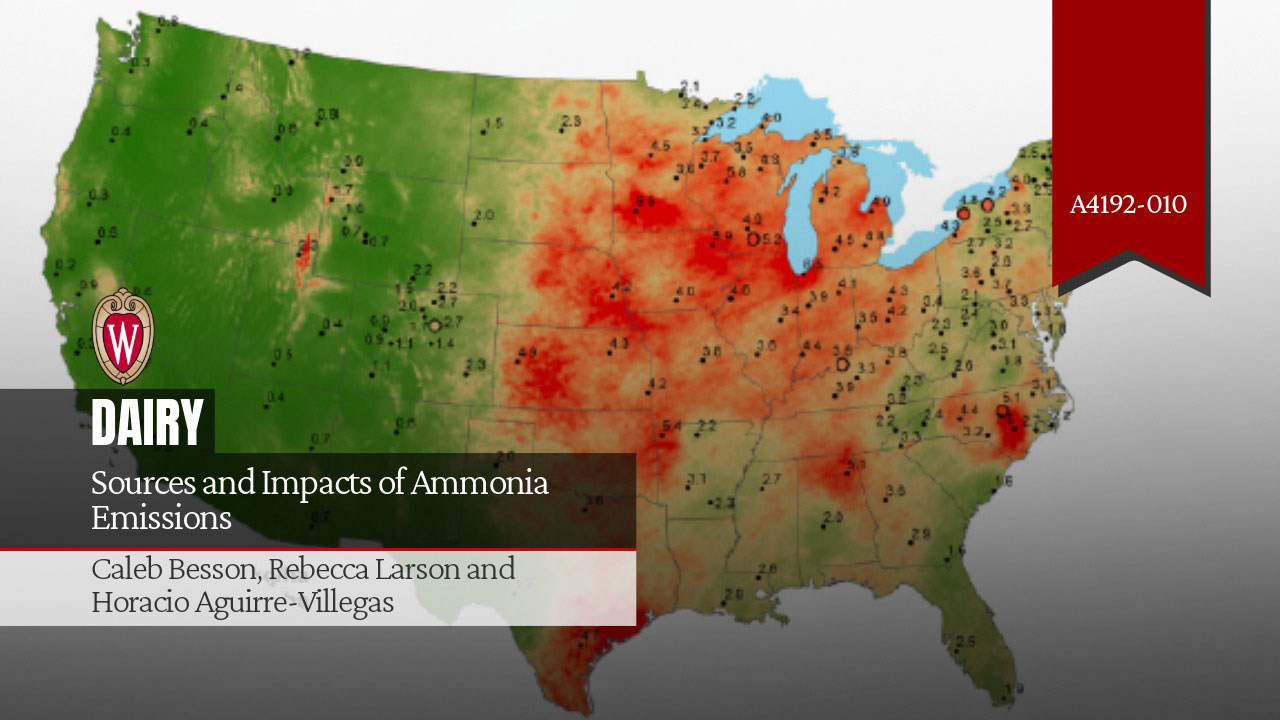
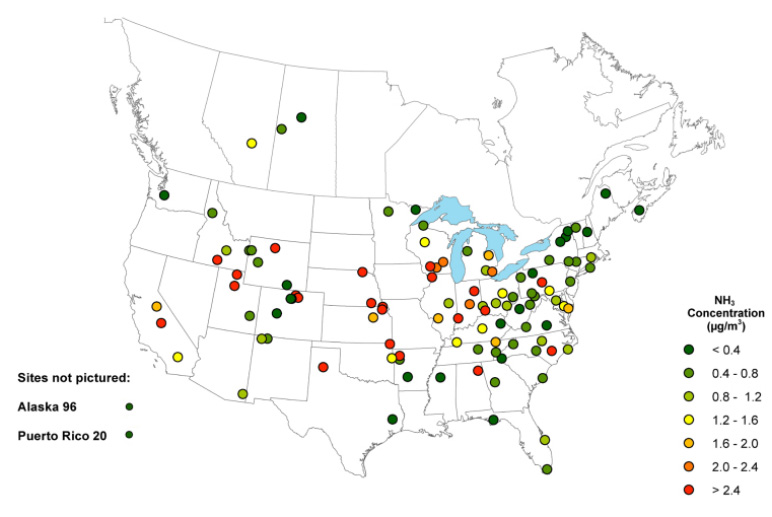
Ammonia concentrations in the atmosphere near the Earth’s surface over the U.S. have been increasing in recent decades (Yao and Zhang 2019; Yu, Nair, and Luo 2018; Warner et al. 2017). Studies recognize several reasons for this increase in concentration. A warming climate is one proposed reason for increased ammonia volatilization from nitrogen fertilizers and manure specifically (Shen et al. 2020). Increased nitrogen fertilizer application to compensate for these ammonia losses and to produce food for a growing population also increases atmospheric ammonia concentrations (He et al. 2021). Recently measured average ammonia concentrations across the U.S. can be seen in Figure 3.
Impacts of Ammonia on the Environment and Human Health
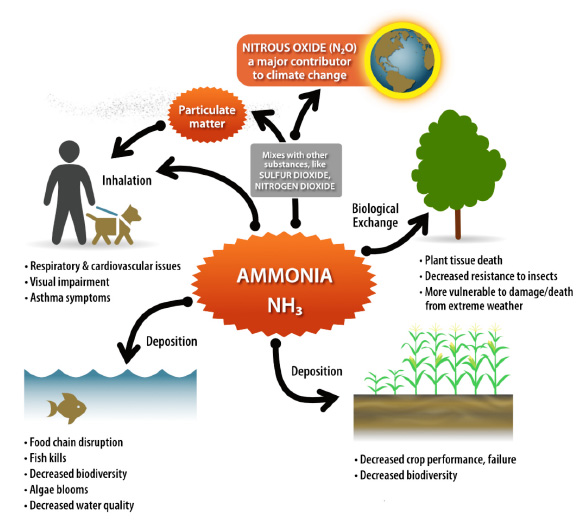
Ammonia has a variable life (hours to a few days) once it is released to the atmosphere before being deposited both near and far from the source of emission (10–100 kilometers on average) (Tournadre et al. 2020; Nair and Yu 2020). Ammonia has the potential to negatively impact human and environmental health (Figure 4). When concentrated, ammonia exposure causes acute symptoms such as eye and nose irritation and coughing (50 to 100 ppm). As concentrations increase, impacts increase in severity to airway disfunction (150 ppm), and death (2,500 ppm and greater) (NRC 2008). Chronic exposure to ammonia inhalation at lower concentrations causes respiratory irritation with asthma-like symptoms and decreased lung function (Ali et al. 2001; Rahman, Bråtveit, and Moen 2007). Indirectly, ammonia can also react with other gases in the atmosphere and create fine particulate matter (PM₂.₅) which can be inhaled by humans negatively impacting cardiovascular and respiratory health (Brook et al. 2010).
Ammonia released into the atmosphere can be deposited directly on land or water damaging ecosystem health (known as ammonia deposition). When deposited on land, ammonia increases soil acidity negatively impacting plant growth and overall biodiversity (Behera et al. 2013; Krupa 2003). Deposited ammonia can damage plant tissue and decrease plant ability to resist extreme weather conditions and pathogens (Guthrie et al. 2018). Runoff of deposited ammonia or direct deposition to water bodies increases the concentration of nitrogen in water. This can lead to eutrophication (or a reduction in water quality, including algae blooms) that impacts recreation, contaminates drinking water sources, causes fish kills, impacts aquatic ecosystems, and decreases biodiversity (Paerl, Dennis, and Whitall 2002; Guthrie et al. 2018). Ammonia also interacts with soil bacteria and can transform into nitrate, which can enter groundwater through leaching (Paerl, Dennis, and Whitall 2002). Ammonia deposition on soil can also contribute to the formation of nitrous oxide, a potent greenhouse gas (Krupa 2003).
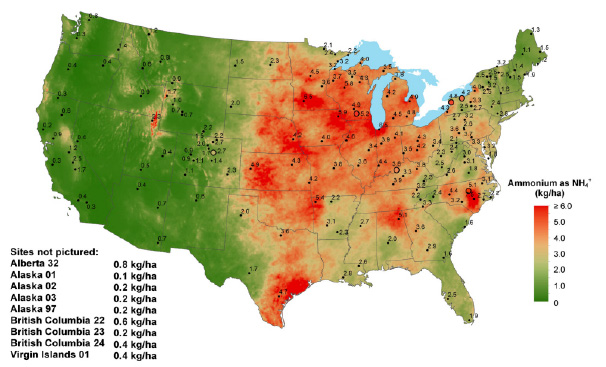
Ammonium ions can serve as a marker for ammonia deposition. Data from 2020 indicates ammonium ion concentrations from wet deposition are highest in the Midwest and Great Lakes region, continuing through Texas and some of the Southeast (Figure 5) (NADP 2021). High ammonium ion concentrations in regions such as the Midwest and Texas are related to livestock emissions from manure, urine, and bedding (Felix, Elliott, and Gay 2017).
Ammonia Emissions and Animal Agriculture
Nationally, agriculture is responsible for 70% to 82% of ammonia emissions (U.S. EPA 2021; Behera et al. 2013; Roe et al. 2004). Manure is a significant source of those ammonia emissions. Livestock has varying rates of efficiency in nitrogen use from their diets and, as a result, pass much of consumed nitrogen that is not used into urine and feces. For example, dairy cows pass 75 to 80% of dietary nitrogen out in urine and feces. In livestock facilities, urinary nitrogen as urea causes the majority of ammonia emissions (Hristov 2011). Globally, cattle are responsible for nearly half of all livestock ammonia emissions where, in decreasing order of emissions, goats, pigs, chickens, sheep, buffalo, ducks, and horses make up the rest (Liu et al. 2022).
Factors that increase ammonia emissions in agricultural systems are similar to factors that promote nitrous oxide emissions and nitrate leaching. Warm, moist environments with high pH cause high nitrogen loss from fields where manure or synthetic nitrogen fertilizers are spread (Mahmud et al. 2021). Loss of nitrogen through ammonia emissions also leads to financial loss for the farmer. Nitrogen fertilizers must then be purchased to replace what is lost, further contributing to ammonia emissions when applied. Emissions can be reduced through improved manure management practices, particularly by injecting or incorporating manure after application. Aside from manure management, practices to reduce ammonia emissions include cover crops for nitrogen fixation, improving livestock nutrition management to reduce excreted nitrogen, and reducing soil pH (Mahmud et al. 2021).
How are Ammonia Emissions Measured or Estimated?
Quantifying ammonia emissions is important to establish baselines and propose strategies to reduce health and environmental impacts. Ammonia emissions can be measured or estimated using experimental methods and models, respectively. Experimental methods include both atmospheric, ground-based measurements, and remote sensing satellite technology utilizing spectrometry from satellites (Nair and Yu 2020; Heald et al. 2012).
Modeling ammonia emissions can be used to quantify emissions across a system using data from experimental methods. Outputs from these models help scientists and farmers identify strategies to reduce emissions from a system, including a farm. In general, ammonia emissions can be modeled by using process-based and statistical models. Process-based models represent or simulate a biological system and the related processes within that system. These models include the interactions (e.g., physical, chemical, biological, geological, etc.) between the system and other variables such as management practices and environmental factors. For example, process-based modeling can be used to represent different manure management systems based on the relationships between ammonia emissions and manure characteristics, management practices, and ambient temperature. Statistical models use experimental data to verify the mathematical relationship between the emissions data and other variables such as environmental factors, management practices, manure characteristics, etc.
Models and experimental data can be used to understand the source and magnitude of ammonia emissions as well as make decisions on management practices that minimize ammonia losses. Management practices such as composting, increased milk production, or diet modifications for example can be modeled to assess their impact on emission losses from an entire system (IPCC 2019). The modeled emissions from a system with and without the selected management practice can provide information on the impact of integrating this practice. This can be used to compare various management practices for one system before investing in the technology or practice.
Summary
Ammonia emissions are predominantly released from human activities. Agricultural activities are the major contributor to ammonia emissions, particularly from livestock manure and fertilizer application. Ammonia can affect human health or form other substances, such as particulate matter, that have negative health and environmental impacts. Once ammonia is released into the atmosphere, it can redeposit onto land and water causing environmental degradation. Nitrogen losses from agricultural systems also result in financial losses as the fertilizer value is lost. This creates the need to purchase synthetic nitrogen fertilizers that have an economic burden but also contribute to environmental impacts during production. Measuring and modeling emissions from different management practices can provide insight and guidance on how to reduce losses.
References
- Aguirre-Villegas, H. A., R. A. Larson, and M. D. Ruark. 2018. “Managing Manure Nitrogen to Reduce Losses.” Manure Processing for Farm Sustainability Series UW Extension A4131-10 (GWQ 082). https://cdn.shopify.com/s/files/1/0145/8808/4272/files/A4131-10.pdf
- Aguirre-Villegas, H. A., M. D. Ruark, and R. A. Larson. 2018. “Nitrogen Cycling in Soils within a Dairy Production System.” Manure Processing for Farm Sustainability Series UW Extension A4131-11 (GWQ 083). https://cdn.shopify.com/s/files/1/0145/8808/4272/files/A4131-11.pdf
- Ali, B. A., H. O. Ahmed, S. G. Ballal, and A. A. Albar. 2001. “Pulmonary Function of Workers Exposed to Ammonia: A Study in the Eastern Province of Saudi Arabia.” International Journal of Occupational and Environmental Health 7(1):19–22. https://doi.org/10.1179/107735201800339669
- Behera, S. N., M. Sharma, V. P. Aneja, and R. Balasubramanian. 2013. “Ammonia in the Atmosphere: A Review on Emission Sources, Atmospheric Chemistry and Deposition on Terrestrial Bodies.” Environmental Science and Pollution Research International 20(11):8092–8131. https://doi.org/10.1007/s11356-013-2051-9
- Brook, R. D., S. Rajagopalan, C. A. Pope, J. R. Brook, A. Bhatnagar, A. v. Diez-Roux, F. Holguin et al. 2010. “Particulate Matter Air Pollution and Cardiovascular Disease.” Circulation 121(21):2331–78. https://doi.org/10.1161/CIR.0b013e3181dbece1
- Felix, J. D., E. M. Elliott, and D. A. Gay. 2017. “Spatial and Temporal Patterns of Nitrogen Isotopic Composition of Ammonia at U.S. Ammonia Monitoring Network Sites.” Atmospheric Environment 150:434–42. https://doi.org/10.1016/J.ATMOSENV.2016.11.039
- Guthrie, S., S. Giles, F. Dunkerley, H. Tabaqchali, A. Harshfield, B. Loppolo, and C. Manville. 2018. “The Impact of Ammonia Emissions from Agriculture on Biodiversity.” The Royal Society. RAND Corporation, Santa Monica California and Cambridge, UK. https://royalsociety.org/topics-policy/publications/2018/ammonia-emissions-evidence-synthesis/
- He, Y., R. Xu, S. A. Prior, D. Yang, A. Yang, and J. Chen. 2021. “Satellite-Detected Ammonia Changes in the United States: Natural or Anthropogenic Impacts.” Science of The Total Environment 789:147899. https://doi.org/10.1016/J.SCITOTENV.2021.147899
- Heald, C. L., J. L. Collett Jr., T. Lee, K. B. Benedict, F. M. Schwander, Y. Li, L. Clarisse et al. 2012. “Atmospheric Ammonia and Particulate Inorganic Nitrogen over the United States.” Atmospheric Chemistry and Physics 12(21):10295–312.
- Hristov, A. N. 2011. “Technical Note: Contribution of Ammonia Emitted from Livestock to Atmospheric Fine Particulate Matter (PM2.5) in the United States.” Journal of Dairy Science 94(6):3130–36. https://doi.org/10.3168/JDS.2010-3681
- IPCC, Intergovernmental Panel on Climate Change. 2019. 2019 Refinement to the 2006 IPCC Guidelines for National Greenhouse Gas Inventories. Volume 4 Agriculture, Forestry, and Other Land Use: Chapter 10: Emissions from Livestock and Manure Management. https://www.ipcc-nggip.iges.or.jp/public/2019rf/vol4.html
- Killpack, S. C., and D. Buchholz. 1993. “Nitrogen in the Environment: Ammonia Volatilization.” University of Missouri Extension. https://extension.missouri.edu/publications/wq257
- Krupa, S. V. 2003. “Effects of Atmospheric Ammonia (NH₃) on Terrestrial Vegetation: A Review.” Environmental Pollution 124(2):179–221. https://doi.org/10.1016/S0269-7491(02)00434-7
- Liu, L., W. Xu, X. Lu, B. Zhong, Y. Guo, X. L., Y. Zhao et al. 2022. “Exploring Global Changes in Agricultural Ammonia Emissions and Their Contribution to Nitrogen Deposition since 1980.” Proceedings of the National Academy of Sciences 119(14):e2121998119. https://doi.org/10.1073/pnas.2121998119
- Mahmud, K., D. Panday, A. Mergoum, and A. Missaoui. 2021. “Nitrogen Losses and Potential Mitigation Strategies for a Sustainable Agroecosystem.” Sustainability 13(4):2400. https://doi.org/10.3390/su13042400
- NADP, National Atmospheric Deposition Program, and Wisconsin State Laboratory of Hygiene. 2021. “National Atmospheric Deposition Program 2020 Annual Summary: Atmospheric Ammonia Concentrations and Trends by Region.” Wisconsin State Laboratory of Hygiene, University of Wisconsin Madison, WI. https://nadp.slh.wisc.edu/wp-content/uploads/2021/10/2020as.pdf
- Nair, A. A., and F. Yu. 2020. “Quantification of Atmospheric Ammonia Concentrations: A Review of Its Measurement and Modeling.” Atmosphere 11(10):1092. https://doi.org/10.3390/atmos11101092
- NRC, National Research Council (US) Committee on Acute Exposure Guideline Levels. 2008. “Ammonia Acute Exposure Guideline Levels.” Acute Exposure Guideline Levels for Selected Airborne Chemicals 6. https://www.ncbi.nlm.nih.gov/books/NBK207883/
- Paerl, H. W., R. L. Dennis, and D. R. Whitall. 2002. “Atmospheric Deposition of Nitrogen: Implications for Nutrient over-Enrichment of Coastal Waters.” Estuaries 25(4):677–93. https://doi.org/10.1007/BF02804899
- Rahman, M. H., M. Bråtveit, and B. E. Moen. 2007. “Exposure to Ammonia and Acute Respiratory Effects in a Urea Fertilizer Factory.” International Journal of Occupational and Environmental Health 13(2):153–59. https://doi.org/10.1179/oeh.2007.13.2.153
- Roe, S. M., M. D. Spivey, H. C. Lindquist, K. B. Thesing, R. P. Strait, and E. H. Pechan & Associates Inc. 2004. “Estimating Ammonia Emissions From Anthropogenic Nonagricultural Sources.” U.S. Environmental Protection Agency (U.S. EPA), Washington DC. https://www.epa.gov/sites/default/files/2015-08/documents/eiip_areasourcesnh3.pdf
- Shen, H., Y. Chen, Y. Hu, L. Ran, S. K. Lam, G. K. Pavur, F. Zhou, J. E. Pleim, and A. G. Russell. 2020. “Intense Warming Will Significantly Increase Cropland Ammonia Volatilization Threatening Food Security and Ecosystem Health.” One Earth 3(1):126–34. https://doi.org/10.1016/j.oneear.2020.06.015
- Tournadre, B., P. Chelin, M. Ray, J. Cuesta, R. D. Kutzner, X. Landsheere, A. Fortems-Cheiney et al. 2020. “Atmospheric Ammonia (NH₃) over the Paris Megacity: 9 Years of Total Column Observations from Ground-Based Infrared Remote Sensing.” Atmospheric Measurement Techniques 13(7):3923–37. https://doi.org/10.5194/amt-13-3923-2020
- U.S. Environmental Protection Agency (U.S. EPA). 2021. 2017 NEI Data: Air Emissions Inventories 2021. U.S. Environmental Protection Agency (U.S. EPA). https://enviro.epa.gov/envirofacts/embed/nei?pType=SECTOR&pReport=nation&pPollutant=&pPollutant=NH3&pYear=2017&pWho=NEI
- U.S. Environmental Protection Agency (U.S. EPA). 2017. “CADDIS Volume 2: Ammonia.” U.S. Environmental Protection Agency (U.S. EPA). https://www.epa.gov/caddis-vol2/ammonia#tab-6
- Warner, J. X., R. R. Dickerson, Z. Wei, L. L. Strow, Y. Wang, and Q. Liang. 2017. “Increased Atmospheric Ammonia over the World’s Major Agricultural Areas Detected from Space.” Geophysical Research Letters 44(6):2875–84. https://doi.org/10.1002/2016GL072305
- Yao, X., and L. Zhang. 2019. “Causes of Large Increases in Atmospheric Ammonia in the Last Decade across North America.” ACS Omega 4(26):22133–42. https://doi.org/10.1021/acsomega.9b03284
- Yu, F., A. A. Nair, and G. Luo. 2018. “Long-Term Trend of Gaseous Ammonia Over the United States: Modeling and Comparison With Observations.” JGR Atmospheres 123(15):8315–25. https://doi.org/10.1029/2018JD028412
- Zhu, L., D. K. Henze, J. O. Bash, K. E. Cady-Pereira, M. W. Shephard, M. Luo, and S. L. Capps. 2015. “Sources and Impacts of Atmospheric NH₃: Current Understanding and Frontiers for Modeling, Measurements, and Remote Sensing in North America.” Current Pollution Reports 1(2):95–116. https://doi.org/10.1007/s40726-015-0010-4
Originally Published: January 11, 2022
Reviewers:
- John Shutske – Professor and Extension Specialist for the Biological Systems Engineering Department
- Megan Nelson – Dairy and Livestock Program Manager for the Division of Extension
- Ross Edwards – Senior Scientist for the Wisconsin State Laboratory of Hygiene, all at the University of Wisconsin–Madison
Authors
- Caleb Besson
- Rebecca Larson
- Horacio Aguierre-Villegas