Table of Contents
Introduction
Once every five years base change will happen for bull proofs, this will happen in April 2025 A PTA for production traits is intended to tell the difference between the daughters of a bull and her herdmates. Fortunately, the genetic merit of our national dairy herd is getting better, so once every five years, we adjust the base to account for the improvement of the herdmates. The base change is set to compare the genetics with the average animal born in 2020, a step-up of five years from the previous base.

Database for dairy cattle
The database for dairy cattle is foundational for the genetic advancement that has been accomplished over the last 70 years. DHI records, classification scores, herd health and fertility data, and genomic markers combined to represent many millions of data points to base genetic estimates on. There are now over ten million dairy animals in the genomic data base. Some believe that with continued selection, further progress becomes more difficult to obtain. We are not at that point in dairy cattle, genomic testing has increased the early accuracy of the estimates of an animal’s genetic merit. Also, many traits more recently quantified, such as herd health and fertility estimates, have not been selected for in many generations at this time. The increase in computer power and the linking with herd health record software have made some traits available only fairly recently. Progress is faster than ever. Once single trait selection, milk production for example, came with losses in fertility and conformation traits, but selection indexes used today have resulted in more balanced progress across 49 evaluated traits. The traits within the indexes are weighted based on economic importance.
Changes in the economics driving dairy farms, for instance the price of butterfat and protein, change over time. The April indexes for Lifetime Net Merit (NM$), Lifetime Cheese Merit (CM$), Lifetime Fluid Merit (FM$), and Lifetime Grazing Merit (GM$) will be updated to account for the base change. In addition the formulas have been updated to account for changes in the economics impacting dairy farms. Pick the index that most closely reflects your farm. NM$ is a catchall to reflect the entire industry, CM$ reflects well our pricing in the upper Midwest, FM$ fits well in the Southeast US where milk protein is less valued and GM$ emphasizes fertility as in important criteria need for grass based dairies.
Table 1. Estimated base change for selected traits in three dairy breeds April Sire Update.
| Trait Name | Units | Brown Swiss | Holstein | Jersey |
|---|---|---|---|---|
| Milk | Pounds | 350 | 750 | 400 |
| Fat | Pounds | 10 | 45 | 20 |
| Protein | Pounds | 15 | 30 | 15 |
| Somatic Cell Score | Log base 2 units | 0 | -0.1 | 0 |
| Productive Life | Months | 1 | 2.5 | 1.5 |
| Livability | % | 0.5 | 0.5 | 0.5 |
| Mastitis | % | -0.2 | 0.75 | -1 |
| Daughter Pregnancy Rate | % | -0.6 | -0.2 | -0.4 |
| Cow Conception Rate | % | -0.5 | 0.5 | 0 |
| Heifer Conception Rate | % | 0.1 | 1 | 1.5 |
| Early First Calving | Days | 0.5 | 2 | 2 |
| Residual Feed Intake | Pounds | – | -40 | – |
| Final Score | 0.2 | 0.6* | 0.6 |
https://uscdcb.com/national-dairy-genetic-index-update-base-change-set-for-april-2025/
It is interesting to note that some important traits are negatively correlated with each other, for example production and fertility. Balancing these traits in a selection index has allowed genetic progress in nearly all traits. This is especially true in the Holstein breed, which is healthier and more fertile today as compared to 15 years ago when selection for the health and fertility traits had just begun. This was accomplished while still advancing genetic merit for production. These early estimates are approximate and will change slightly when the actual calculations are made in April.
Genomics is Accelerating Genetic Progress
Figure 2.
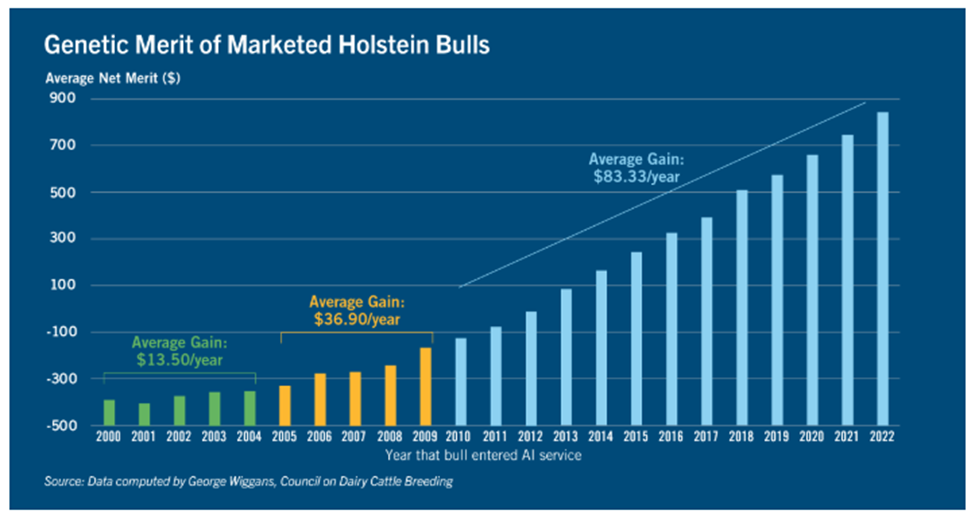
Genomic testing of over ten million dairy cattle to date has improved the accuracy of indexes such as NM$, especially for younger animals that do not yet have their own production records. This has allowed for a shortening of generation interval and the introduction of accurately identified superior animals into the selection scheme much sooner in life. This increased progress, as shown in Figure 2, increases the importance of the five-year genetic base update to keep the scale of the estimates meaningful for producers.
Adjust your criteria
In April 2025, the scale of the numbers for traits such as NM$, milk, fat, and protein are estimated to decrease by about the amounts indicated in Figure 1. This will set the breed average of cows born in 2020 to zero. This does not mean our selection system was inaccurate, it means that it has been rescaled due to rapid genetic progress and improved accuracy, an indicator of the success of our national dairy cattle selection scheme. A base change is like getting a new prescription for glasses, things will look different and be a surprise until accounting for the change. Animals will look worse, but they should still rank similarly, they are just being compared to a new, higher standard. This results not only in more profitable and efficient cattle, but also rapidly improving sustainability of dairy production.
Reviewers
by Jackie McCarville
Regional Dairy Educator
University of Wisconsin-Madison, Division of Extension
Ryan Sterry
Regional Livestock Educator
University of Wisconsin-Madison, Division of Extension
Angie Ulness
County Dairy Educator
University of Wisconsin-Madison, Division of Extension
Author

Matthew Lippert
Regional Dairy Educator – Matt’s focus is on dairy production, dairy cattle nutrition, dairy genetics and farm management. He works closely with grower organizations developing educational programs and newsletters.
 Single Gene Traits in Dairy Cattle
 It’s Proof Time! How You Can Decode Dairy Sire Summaries
 Getting the Dairy Herd You Want Through Improved Genetic Selection
 What kind of dairy cow should you be creating?