
Introduction
Every dairy farmer knows that the first few weeks after calving are critical. Fresh cows face a cascade of health challenges – metritis, ketosis, displaced abomasum, milk fever, retained placenta, and mastitis – that can drain profitability through lost milk, delayed pregnancies, higher culling, and veterinary bills. What is less clear is exactly how much these problems cost, and whether spending more on fresh cow monitoring would actually pay for itself.
The Fresh Cow Program Economic Analyzer is a new online tool from the Dairy Management Decision Support program at UW-Madison (dairymgt.info ↗️) that helps answer that question. It compares the cost of fresh cow disease under your current monitoring program against a proposed improved program and tells you whether the investment is worth it.
What does the tool do?
The tool calculates the total annual economic cost of six major transition cow disorders for your herd:
- Metritis
- Clinical ketosis
- Displaced abomasum
- Hypocalcemia (milk fever)
- Retained placenta
- Clinical mastitis in the first 30 days
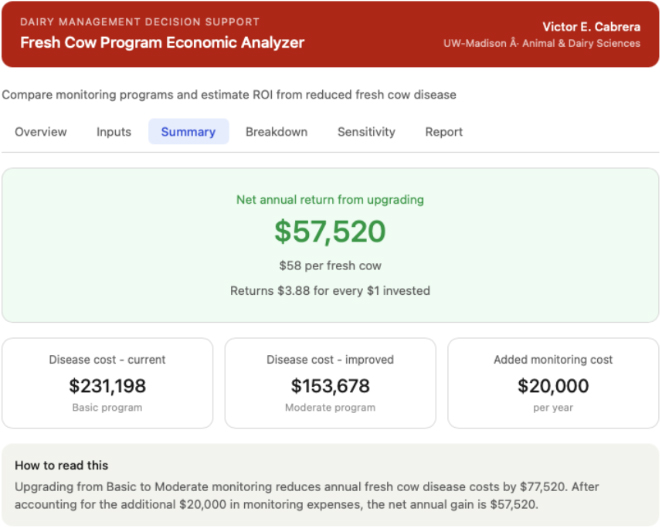
It does this twice – once for your current fresh cow program, and once for an improved program you are considering – and then compares the two. The bottom line is a single number: your net annual return from upgrading (Figure 1).
How does it work?
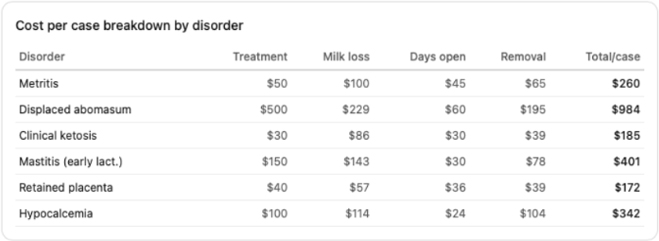
For each disorder, the tool estimates the total economic damage of a single case by adding up four cost components:
Treatment cost – what you spend on veterinary care, drugs, and labor per case.
Milk loss – the total lactation milk loss caused by the disorder, valued at your milk price and adjusted for feed savings on the milk not produced. These are not just the pounds lost during the acute illness; they capture the carry-over effect on production losses that can persist for months.
Reproductive cost – the additional days open caused by the disorder, multiplied by your cost per day open. Fresh cow diseases are well known to delay breeding and reduce conception rates.
Removal cost – the increased risk of culling or death attributable to the disorder, multiplied by your net replacement cost.
These four components are added together to give a total cost per case. Multiply by the number of cases in your herd, and you get the total annual cost for that disorder (Figure 2). Add up all six disorders, and you have the total annual cost of fresh cow disease for your herd.
What do you need to enter?
The tool is designed to be simple. You need two types of information:
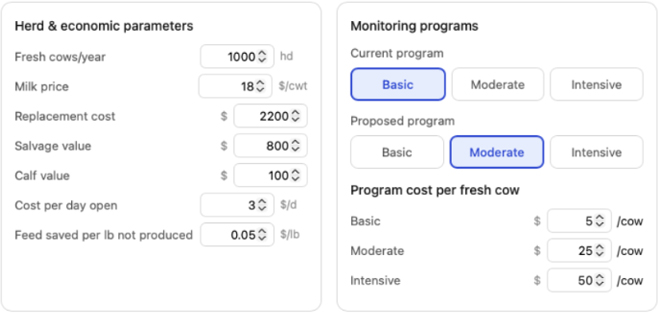
Your herd and economic numbers. Herd size, milk price, replacement cost, salvage value, calf value, and cost per day open. Most farmers know these or can estimate them quickly.
Your monitoring programs. You select a level for your current program and the program you are considering. The tool offers three levels – Basic, Moderate, and Intensive – and fills in default disease rates based on published research. If you know your own herd’s disease rates, you can enter them directly (Figure 3).
The three monitoring levels are defined by the user, but in general:
Basic – minimal structured monitoring. You rely on visual observation and treat cows when clinical signs become obvious. There is no systematic health check protocol or routine metabolic testing.
Moderate – structured daily health checks for the first 10-14 days in milk, including temperature monitoring and routine BHB testing to catch ketosis early. Prompt treatment protocols are in place.
Intensive – everything in Moderate, plus pre-calving metabolic monitoring, systematic metritis screening, a ketosis test, prophylactic calcium supplementation for older cows, and dedicated fresh cow pen management with controlled stocking density.
What about the disease defaults?
The tool comes loaded with default values for treatment costs, milk loss, days open penalties, removal risk, and disease incidence at each monitoring level (Figure 4). These are based on published research and represent reasonable estimates for a typical US dairy herd.
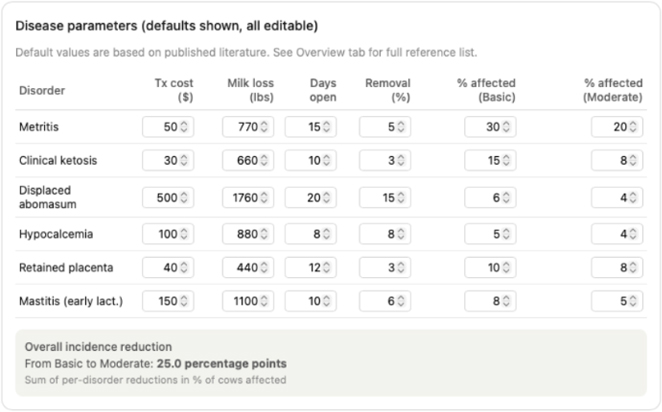
You do not need to accept these defaults. If you know your herd’s metritis rate is 25% rather than 30%, change it. If your DA surgery costs $600 instead of $500, change that too. The tool recalculates instantly.
The key point is that you do not need perfect data to get useful results. Even approximate numbers will tell you whether the investment in better monitoring is in the right ballpark.
An example
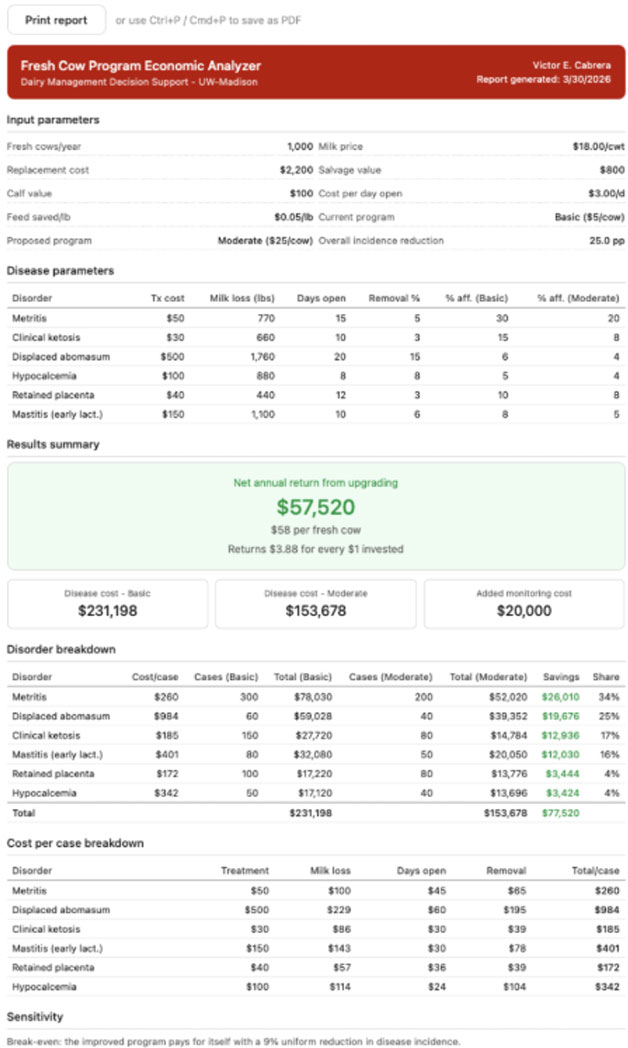
Consider a 1,000-cow dairy currently running a Basic fresh cow program and considering an upgrade to Moderate. Using the tool’s default values:
- Fresh cow disease costs the herd approximately $231,198 per year under the Basic program.
- Under the Moderate program, disease costs drop to approximately $153,678 per year.
- The Moderate program costs an additional $20,000 per year in monitoring expenses (labor, BHB strips, etc.).
- The net annual return from upgrading is approximately $57,520, or about $58 per fresh cow.
That is a return of roughly $3.88 for every $1 invested in additional monitoring (Figure 1).
Which health disorders matter most?
Not all health disorders contribute equally to the economic case for better monitoring. The Breakdown tab ranks disorders by how much savings they generate when you upgrade (Figure 5).
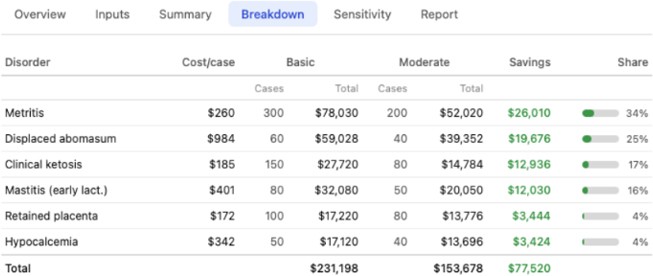
In the default scenario, metritis and displaced abomasum together account for over half of the total savings. This is useful information even if you are not ready for a full program upgrade – it tells you where the highest-value interventions are.
What if I am not sure about the numbers?
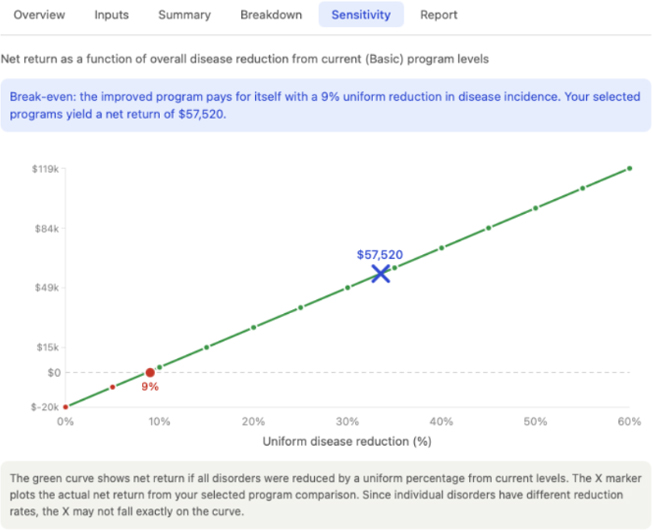
The Sensitivity tab addresses this directly. It shows a curve of net return across a range of possible disease reduction levels, so you can ask yourself: “Even if the actual improvement is only half of what the defaults suggest, does the upgrade still pay?”
For the default example, the break-even point is approximately a 9% reduction in overall disease incidence (Figure 6). In other words, even a modest improvement in fresh cow health would justify the investment in better monitoring. This gives farmers confidence that the conclusion is robust, even if the default assumptions are not perfectly calibrated to their herd.
Getting started
The Fresh Cow Program Economic Analyzer is available at dairymgt.info. It runs in any web browser with no software to install. You can generate a printable report of your results to share with your veterinarian, nutritionist, or management team (Figure 7).
Take home message
The tool joins a suite of dairy management decision-support tools developed at UW-Madison that cover reproduction, replacement, feeding, and other management areas.
For more information, visit dairymgt.info ↗️ or contact Victor E. Cabrera (vcabrera@wisc.edu) at the Department of Animal and Dairy Sciences, University of Wisconsin-Madison.
References
- Bar, D., et al. (2008). The cost of generic clinical mastitis in dairy cows as estimated by using dynamic programming. J. Dairy Sci., 91(6), 2205-2214. https://doi.org/10.3168/jds.2007-0573
- Beagley, J.C., et al. (2010). Physiology and treatment of retained fetal membranes in cattle. J. Vet. Intern. Med., 24(2), 261-268. https://doi.org/10.1111/j.1939-1676.2010.0473.x
- Cameron, R.E.B., et al. (1998). Dry cow diet, management, and energy balance as risk factors for displaced abomasum in high producing dairy herds. J. Dairy Sci., 81(1), 132-139. https://doi.org/10.3168/jds.S0022-0302(98)75560-2
- Detilleux, J.C., et al. (1997). Effects of left displaced abomasum on test day milk yields of Holstein cows. J. Dairy Sci., 80(1), 121-126. https://doi.org/10.3168/jds.S0022-0302(97)75919-8
- Dubuc, J., et al. (2012). Risk factors and effects of postpartum anovulation in dairy cows. J. Dairy Sci., 95(4), 1845-1854. https://doi.org/10.3168/jds.2011-4781
- Fourichon, C., et al. (2000). Effect of disease on reproduction in the dairy cow: A meta-analysis. Theriogenology, 53(9), 1729-1759. https://doi.org/10.1016/S0093-691X(00)00311-3
- Giuliodori, M.J., et al. (2013). Metritis in dairy cows: Risk factors and reproductive performance. J. Dairy Sci., 96(6), 3621-3631. https://doi.org/10.3168/jds.2012-5922
- Hertl, J.A., et al. (2014). Pathogen-specific effects on milk yield in repeated clinical mastitis episodes in Holstein dairy cows. J. Dairy Sci., 97(3), 1465-1480. https://doi.org/10.3168/jds.2013-7266
- Liang, D., et al. (2017). Estimating US dairy clinical disease costs with a stochastic simulation model. J. Dairy Sci., 100(2), 1472-1486. https://doi.org/10.3168/jds.2016-11565
- Martinez, N., et al. (2012). Evaluation of peripartal calcium status, energetic profile, and neutrophil function in dairy cows at low or high risk of developing uterine disease. J. Dairy Sci., 95(12), 7158-7172. https://doi.org/10.3168/jds.2012-5812
- McArt, J.A.A., et al. (2012). Epidemiology of subclinical ketosis in early lactation dairy cattle. J. Dairy Sci., 95(9), 5056-5066. https://doi.org/10.3168/jds.2012-5443
- Overton, T.R. & Fetrow, J. (2008). Economics of postpartum uterine health. Proc. Dairy Cattle Reproduction Council Convention, 39-43.
- Reinhardt, T.A., et al. (2011). Prevalence of subclinical hypocalcemia in dairy herds. Vet. J., 188(1), 122-124. https://doi.org/10.1016/j.tvjl.2010.03.025
- Rollin, E., et al. (2015). The cost of clinical mastitis in the first 30 days of lactation: An economic modeling tool. Prev. Vet. Med., 122(3), 257-264. https://doi.org/10.1016/j.prevetmed.2015.11.006
- Sheldon, I.M., et al. (2006). Defining postpartum uterine disease in cattle. Theriogenology, 65(8), 1516-1530. https://doi.org/10.1016/j.theriogenology.2005.08.021
- Walsh, R.B., et al. (2007). The effect of subclinical ketosis in early lactation on reproductive performance of postpartum dairy cows. J. Dairy Sci., 90(6), 2788-2796. https://doi.org/10.3168/jds.2006-560
- Wittrock, J.M., et al. (2011). Short communication: Metritis affects milk production and cull rate of Holstein multiparous and primiparous dairy cows differently. J. Dairy Sci., 94(5), 2408-2412. https://doi.org/10.3168/jds.2010-3697
Originally Published: May 2026
Reviewers:
- Carolina Pinzón – Dairy Outreach Specialist at the University of Wisconsin–Madison Division of Extension
- Heather Schlesser – Professor and County Dairy Educator, University of Wisconsin-Madison, Division of Extension, Marathon County
Authors:
- Victor Cabrera – Professor and Dairy Systems Management Specialist, University of Wisconsin-Madison, Division of Extension