Objective
To provide an educational and decision-making tool for dairy educators, consultants, and producers, and to evaluate the nutritive value of corn silage or corn hybrids for potential use in silage production.
Background
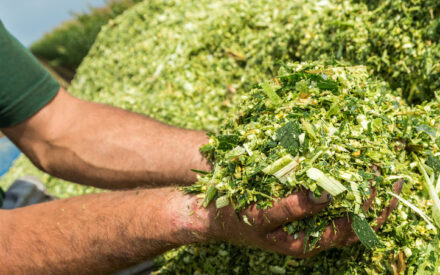
Corn silage is a vital part of dairy rations in the United States, as it provides a good source of energy and effective fiber and because homegrown forages are more cost effective and nutritionally sound than purchased concentrate feeds. Hybrid selection is a key opportunity to influence the nutritive value of corn silage, but many factors must be considered during hybrid selection. This includes multiple nutrients and other traits related to yield, plant health, and drought resistance. To better evaluate the nutritive value of corn silage, the MILK index was developed to predict energy content (milk/ton) and energy yield (milk/acre) of corn silage.
The MILK index was first released in 1990, with subsequent versions released as research progressed and new concepts in dairy cow nutrition were developed (Schwab et al., 2003). The last version of the MILK index released was the MILK2006, which used equations based on TDN to estimate milk yield. Additionally, MILK2006 incorporated in vitro or in situ digestibility of NDF (NDFD) and starch (starchD; among other lab assays as potential inputs) as estimates of in vivo digestibility. However, further advancements, such as the release of the Nutrient Requirements of Dairy Cattle eighth revised edition (NASEM, 2021), have created the opportunity for another update to the MILK index. Therefore, the MILK2024 was developed to include modified NASEM equations and other new concepts.
MILK2024 Facts
- The MILK2024 spreadsheet estimates the energy content (milk/ton) and energy yield (milk/acre) of corn silage. These values are based on the nutrient composition and yield of corn silage or forage.
- The MILK2024 uses a basal diet. Because NASEM (2021) estimates dietary energy, and not the energy of individual feeds, a basal diet was added to the MILK2024 model. The basal diet is based on a typical midwestern diet and includes 30% (DM basis) of the input corn silage or forage. Estimated milk yield in MILK2024 does not include the basal diet. The goal of the MILK index is to estimate the energy of corn forage or silage alone and aid in related decision making, regardless of diet which varies widely from farm to farm.
- Minor changes were made to inputs for MILK2024. Dry matter concentration is no longer required as it was used in the MILK2006 to estimate in vivo starch digestibility and the MILK2024 now uses 7h starchD (% starch) exclusively. The only new input for MILK2024 is 240h uNDF (% DM), which is used along with NDFD (%NDF) in the calculations for in vivo NDFD.
- Starch and NDF digestibility are calculated with mechanistic models. The rate of digestion of NDF is estimated from in vitro or in situ NDFD with 30h or 48h timepoints. Similarly, the rate of digestion of starch is estimated from 7h starchD. Previous versions of the MILK index used regressions to predict digestibility or used in vitro or in situ measurements as estimates of in vivo digestibility of these nutrients.
- MILK2024 does not calculate total digestible nutrients (TDN). Previously, the MILK index calculated TDN to estimate net energy of lactation (NEL). The NASEM (2021) model calculates digestible energy (DE) of the diet directly, and this is also used in MILK2024. Then, energy losses are subtracted from DE to calculate NEL.
- A different milk composition is used in MILK2024. Previous versions of the MILK index predicted the yield of 3.5% fat-corrected milk. The MILK2024, on the other hand, predicts the yield of milk with 4.0% fat, 3.1% true protein, and 4.8% lactose. The updated milk composition is more representative of modern cows and farms.
- MILK2024 has a greater average value and narrower range for milk/ton. A comparison of predicted milk per ton for MILK2000, MILK2006, and MILK2024 is shown below in Table 1. When comparing MILK models, predicted milk yield for the MILK2024 was slightly greater than the MILK2006. Additionally, the MILK2024 model had a lower range and standard deviation during testing compared to MILK2000 and MILK2006. However, MILK2024 was also able to better separate samples with different nutrient compositions compared to previous versions. This suggests that smaller differences between samples or hybrids in MILK2024 are more meaningful than previous versions.
| Item | MILK2000 milk/ton | MILK2006 milk/ton | MILK2024 milk/ton |
|---|---|---|---|
| Average | 3661 | 2979 | 3086 |
| SD | 156 | 115 | 90 |
| Minimum | 3009 | 2507 | 2779 |
| Maximum | 4104 | 3488 | 3364 |
MILK2024 Inputs
Fiber_Ash Inputs Tab
Users must specify the NDFD timepoint and if fiber values are corrected for ash using this tab.
The MILK2024 uses fiber measurements corrected for residual ash concentration (NDFom, NDFDom, uNDFom). But in case these values are not available, MILK2024 can predict them from the traditional uncorrected measurements (NDF, NDFD, uNDF) and ash concentration.
Similarly, MILK2024 uses 30h NDFD, but can adjust the 48h NDFD so estimates are similar to 30h estimates.
Inputs for this tab are shown below:
- NDF (% DM) or NDFom (% DM). If NDF is corrected for residual ash (NDFom) it should be entered in the “Ash Corrected” section, otherwise NDF should be entered in the “Not Corrected for Ash” section.
- NDFD (% NDF) or NDFDom (% NDFom). Observed 30 or 48h NDFD can be entered at user discretion once the timepoint is properly specified. If NDFD is corrected for residual ash (NDFDom) it should be entered in the “Ash Corrected” section, otherwise NDFD should be entered in the “Not Corrected for Ash” section.
- uNDF (% DM) or uNDFom (% DM). If 240h uNDF is corrected for residual ash (uNDFom) it should be entered in the “Ash Corrected” section, otherwise 240h uNDF should be entered in the “Not Corrected for Ash” section. The concentration of 240h uNDF must be entered on a DM basis in MILK2024, not as a percentage of NDF.
- Ash (% DM). Ash concentration should be entered on a
DM basis.
MILK2024 Tab
With imperial and metric tabs, the MILK2024 spreadsheet allows users to input the remaining nutrient and see the outputs of milk/ton (or milk/Mg) and milk/acre (or milk/ha). Values entered in the Fiber_Ash Inputs tab are brought into these tabs automatically.
- DM Yield (ton/acre or Mg/ha). If users want milk per area predictions, they should input the observed or estimated DM yield into the appropriate tab.
- Starch (% DM). Starch concentration should be entered on a DM basis.
- 7h Starch D (% starch). The StarchD should be entered on a starch basis. Avoid using timepoints other than 7h, as specified in the spreadsheet.
- EE (% DM). Ether extract (EE) should be entered on a DM basis.
- CP (% DM). Crude protein (CP) should be entered on a DM basis.
Outputs and calculations
The first step is predicting corn silage DE, which is based on the nutrient composition and digestibility of corn silage. Digestibility of FA (estimated from EE) and CP (estimated with digestible rumen undegradable protein and rumen degradable protein) are set according to NASEM (2021). The digestibility of ROM (residual organic matter) calculated with NDFom was set at 0.91 (Tebbe et al., 2017). The ruminal digestibility of starch was estimated by calculating rate of digestion from 7h starchD (assuming 1 h of lag) and a rate of passage of 12%/h as used by Hoffman et al. (2012). Ruminal digestibility was corrected to in vivo digestibility according to the equation by Ferraretto et al. (2013).
Ruminal digestibility of NDF was estimated by calculating rate of digestion from 30 or 48h NDFD (assuming 3 h of lag and using the potentially digestible pool by correcting with 240h uNDF) and rate of passage of 3.4%/h from Krizsan et al. (2010) which was corrected for potentially digestible NDF. An additional 10% of NDF digestion is assumed to occur in the hindgut (Combs, 2013). The DE is calculated as if corn silage makes up the entire diet according to NASEM (2021) as shown below.
DE = (0.042 × (NDF% × NDF digestibility)) + (0.0423 × (starch% × starch digestibility)) + (0.0940 × (FA × 0.73) + (0.0565 × (RDP + dRUP)) + (0.040 × (ROM × 0.91))
Where FA is estimated from EE, rumen degradable protein (RDP) and digestible rumen undegradable protein (dRUP) are estimated from CP, and ROM is calculated as ROM = 1- (Ash + NDFom + Starch + FA + CP).
The second step is to estimate the DE of the basal diet, then correct both the basal diet and corn silage DE with their inclusion rate and add them together to give total dietary DE. Once dietary DE has been calculated, energy losses are calculated based on NASEM (2021) and subtracted from DE to reach dietary NEL. Next, maintenance energy and energy from body weight gain are subtracted to estimate the energy available for milk production. Corn silage NEL is estimated from the NEL available for milk production using the ratio of corn silage DE to dietary DE as shown below:
Corn Silage NEL = NEL available for milk production × (Corn silage DE/Dietary DE)
Corn silage NEL is one of the outputs of the MILK2024 and can be used to compare samples input into the spreadsheet. However, using milk per ton (or milk per Mg) and milk per acre (or milk per ha) are more appropriate and better able to capture differences. Corn silage NEL is multiplied by DMI (calculated from Allen et al., 2019; NASEM, 2021), which can then be used to calculate milk production from corn silage per day, assuming a milk composition with 4.0% fat, 3.1% true protein, and 4.8% lactose. Correcting the daily milk production from corn silage for a tonnage basis yields milk per ton as shown below:
Milk per Ton = (Milk from corn silage/Corn silage DMI) × 2000
Finally, multiplying milk per ton by the DM yield calculates milk per acre if users have DM yield available and are interested in estimating energy yield.
Acknowledgements
Appreciation is extended to Joe Lawrence (Cornell University), Cumberland Valley Analytic Services, Dairyland Laboratories, Inc., and Rock River Laboratory, Inc. for providing us with data sets of corn silage or forage nutrient analysis.
Appreciation is also extended to the Dairy Innovation Hub for partially funding this project.
References
Allen, M. S., D. O. Sousa, and M. J. VandeHaar. 2019. Equation to predict feed intake response by lactating cows to factors related to the filling effect of rations. J. Dairy Sci. 102: 7961-7969.
Combs, D. K. 2013. TTNDFD: A new approach to evaluate forages. In proceedings from 2013 Cornell Nutr. Conf. Dept. Anim. Sci., Cornell Univ., Ithaca, NY (2013), pp. 113-125.
Ferraretto, L. F., P. M. Crump, and R. D. Shaver. 2013. Effect of cereal grain type and corn grain harvesting and processing methods on intake, digestion, and milk production by dairy cows through a meta-analysis. J. Dairy Sci. 96: 533-550.
Hoffman, P. C., R. D. Shaver, and D. R. Mertens. 2012. Feed GrainV2.0 background and development guide. UW Extension.
Krizsan, S. J., S. Ahvenjärvi, and P. Huhtanen. 2010. A meta-analysis of passage rate estimated by rumen evacuation with cattle and evaluation of passage rate prediction models. J. Dairy Sci. 93: 5890-5901.
NASEM. 2021. Nutrient requirements of dairy cattle. (8th ed.), The National Academies Press, Washington, DC.
Schwab, E. C., R. D. Shaver, J. G. Lauer, and J. G. Coors. 2003. Estimating silage energy value and milk yield to rank corn hybrids. Anim. Feed Sci. Technol. 109: 1-18.
Tebbe, A. W., M. J. Faulkner, and W. P. Weiss. 2017. Effect of portioning the nonfiber carbohydrate fraction and neutral detergent fiber method on digestibility of carbohydrates by dairy cows. J. Dairy Sci. 100: 6218-6228


 Summer feed storage and feed bunk management
 Check Your Corn Silage Processing During Harvest to Ensure Optimal Nutrition
 Risks of inadequate fiber in the diet
 Introduction to the Dairy Feed Inventory Calculator


