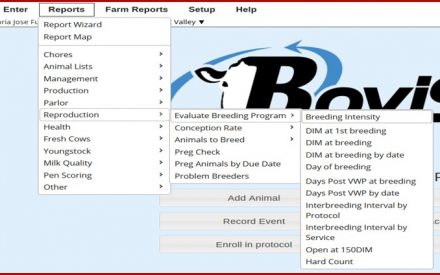
Herd Summary Report
Farmers enrolled in DHI receive several reports regarding herd performance. The Herd Summary Report (HSR) encompasses three main sections: Milk Production, Reproduction & Genetics, and Inventory.
The milk production section has eight blocks—the focus will be on Block D, F, and G. The Reproduction & Genetics section has five blocks—the focus will be on Block L.
Terminology and Definitions
RHA is an average amount of milk produced by the average cow in the herd for the last 365 days.
ME 305 is an expected total milk production for each cow through a 305-day lactation and subsequently adjusting the total projected milk to standardize for parity, age, season of calving, and number of times milked per day. ME 305 better reflects seasonal changes compared to RHA.
MLM standardizes every cow 305 days or less since her last calving, to a second lactation cow, 150 days in milk with a 4.0% fat and 3.3% protein. MLM should be used for short-term comparisons.
Pregnancy rate is the percentage of cows becoming pregnant out of all eligible cows to be bred, within a time frame.
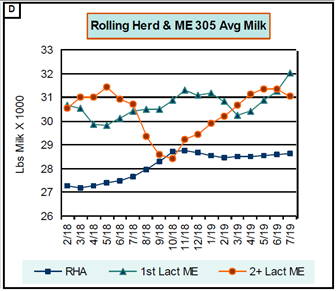
Block D
ME 305 of multiparous cows dropped from June until October. This is a good example of the impact of heat stress. Expected total milk production losses increased as summer went along, and the cold season started.
Remember that heat stress has an immediate and delayed impact on milk production. This can explain
expected milk production losses going into the cold season.
ME 305 of primiparous cows remained consistent. RHA did not reflect any decrease in milk production.
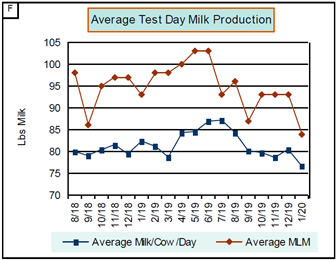
Block F
Average MLM decreased starting on June until September. Compared to average MLM of June, milk production from July to September decreased about 8 pounds (range of 5 to 12.5 pounds) per cow per day. In the figure below, MLM was trending up until May and then dropped. It might be possible that heat stress has caused this drop in production. When looking at this block, farmers should expect upward trends in MLM.
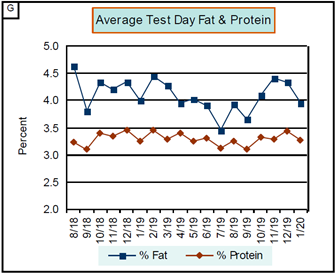
Block G
Loss of milk components, such as fat, is very typical when cows are experiencing heat stress. In the figure below, milk fat depression started in May, and lasted until September. Losses were about 0.35 (range from 0.10-0.57) percentage points per month starting on June-September when compared to percent fat in May. Remember that milk fat varies depending on when (AM or PM) plants conduct monthly testing. Fat is higher in the morning, and you need to keep that in mind when reading your DHI report.
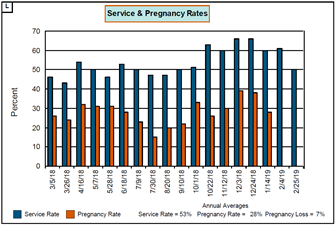
Block L
In the upcoming figure you can see a decrease in pregnancy rates during warmer months compared to colder months. The lowest pregnancy rate was observed on July 30, which was 10 percentage points lower than in March. Again, this is a textbook example of the potential impact of heat stress on reproduction performance.
Conclusion
Heat stress can negatively impact both milk production and reproductive performance. DHI reports offer a summarized snapshot of your herd’s performance. When reviewing your Herd Summary Report, pay attention to seasonal changes, particularly during warmer months. Without a thorough investigation, you cannot rule out heat stress or other factors as the cause of any losses in milk production or reproductive performance.
Economic Impact
The economic impact of heat stress is large. Following the information extracted from the Herd Summary, it is possible to estimate the potential losses.
Assuming a marginal milk production of 2.4 pounds per pound of feed, the loss would be $0.15 per pound of milk not produced (at $0.20 per pound of milk and
$0.12 per pound of feed). A daily loss of 8 pounds per cow per day (Block F) equals to losses of $1.2 per cow per day during summer months.
Considering a price of $2. 8 per pound of fat, 0.35% milk fat depression (Block G) represents a reduced price received for milk sales of $0.98 per hundredweight due to heat stress during warmer months.
A decrease of pregnancy rate from 35% to 25% (Block L) would represent a loss of $7.90 per cow in the month of July compared to the month of May (https://dairymgt.info/markov/reader.php ↗️).
Take Home Messages
- Use DHI reports to look for seasonal changes.
- Use ME 305 to account for seasonal changes in milk production.
- Milk fat content can vary depending on the time of day the plant tests (morning vs. afternoon).
- Form a team to investigate seasonal depression in milk production. Involve your herd veterinarian, dairy consultants, nutritionists, and herd manager.
- Assess the economic impact of heat stress on your herd to motivate actions and investments in mitigating its effects.
Author

Carolina Pinzón-Sánchez
Bilingual Dairy Outreach Specialist – As a statewide Dairy Outreach Specialist, Carolina identifies needs and incorporates research findings into high-quality outreach education programs around dairy production.

Victor Cabrera
Dairy Systems Management Extension Specialist, Professor, Honorary Associate/Fellow– Dr. Cabrera uses applied research, interdisciplinary approaches, and participatory methods to deliver practical, user-friendly, and scholarly decision support tools for dairy farm management aimed to improve dairy farm profitability, environmental stewardship, and long-term sustainability of the dairy farm industry.
Original Authors
Dr. Maria Jose Fuenzalida, Theodore Halbach, Dr. Victor Cabrera, and Lyssa Seefeldt.
Original publication date: July, 2020
Revised: April, 2025
References
- Herd summary interpretative manual available at: http://documents.crinet.com/AgSource- Cooperative-Services/DHI/B0293-059- HerdSummaryInterpretiveManual-2011.pdf
- UW-Madison Dairy Management Tools Website available at: https://DairyMGT.info