Skip to content
UW Crest

Dairy

Division of Extension

  • HPAI
  • Topics
    • Animal Welfare & Herd Health
    • Emerging Technologies and Facilities
    • Feed and Nutrition
    • Heat Stress
    • Milk Quality and Milking Systems
    • Reproduction and Genetics
  • Events
  • News
  • Dairy Programs
    • Badger Dairy Insight
    • El “Break” Info-Lechero
    • Four-State Nutrition and Management Conference
    • Midwest Manure Summit
    • Milk Quality from the Udder World: Trainer Certification Program
  • Articles
  • Newsletters
    • Dairy Newsletter
    • Bovi-Noticias
  • People
  • About
    • About the Dairy Program
    • Our Impacts
    • Sign-up for the Dairy Program Newsletter
  • Contact Us
Search
University of Wisconsin-Extension
Articles > Heat Stress

Using Bovisync Reports to Assess Potential Impact of Heat Stress on a Dairy

Written by Carolina Pinzón-Sánchez and VICTOR E CABRERA
Share
  • Share:
  • Share on Facebook
  • Share on X (Twitter)
  • Share via Email
  • Copy Link

Copied!

Using Bovisync Reports to Assess Potential Impact of Heat Stress on a Dairy

How Can You Find the Tell-Tale Signs of Heat Stress in Your Records?
Milk Production
Fat Percent
Milk Quality
Reproduction
Clinical Mastitis and Transition Cow Health
Economic Impact
Take Home Messages


This article is part of the
Dairy Heat Stress Collection


Hands typing on laptop with yellow background. Title: "Using Bovisync Reports to Assess Potential Impact of Heat Stress on a Dairy"

How Can You Find the Tell-Tale Signs of Heat Stress in Your Records?

Here are a few of the key areas to watch for:

  • Reduced milk production.
  • Butterfat depression.
  • Declines in reproductive performance.
  • Increases in clinical and sub-clinical mastitis.
  • Increased morbidity in transition cows.

In this fact sheet you will see examples of the resulting data you can use to unlock the power of your herd’s Bovisync records.

https://www.youtube.com/watch?v=M6pGbP62Yc4

Milk Production

Figure 1. Mature Equivalent 305 (305 ME) by lactation group over a 12-month period. The graph shows that group 3 ME 305 starts at a higher level than group 1 or 2. Then there is a significant drop in 305 ME for group 3 in June that hits the trough in September, and returns to levels similar to group 1 and 2 in October. Groups 1 and 2 remain relatively constant through the whole graph timespan.
Figure 1. Mature Equivalent 305 (305 ME) by lactation group over a 12-month period.

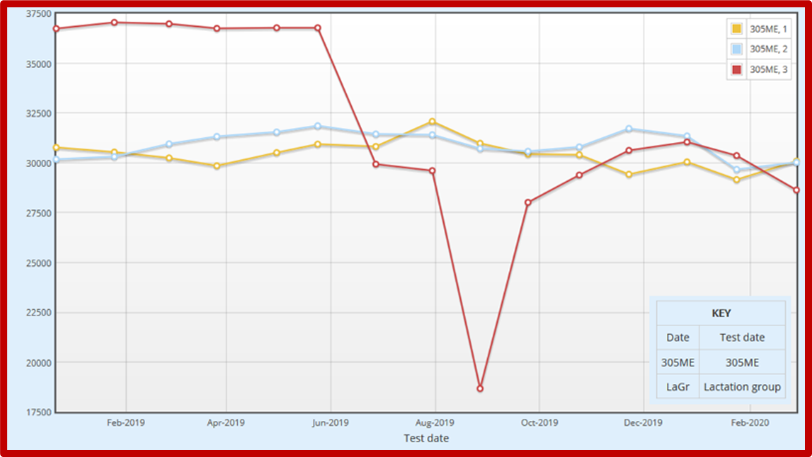
In Figure 1, 305 ME of lactation group 3 (lactation ≥3) started dropping in June until September. This is an example of what milk depression could look like when cows experience heat stress. 305 ME of first and second lactation cows remained consistent.

Figure 2. Average daily milk production per cow by lactation group over a 24-month period. In figure 2, a sharp depression in milk production in lactation group 3 is observed in July 2019. Compared to average daily milk production of February, milk production from March to July decreased about 30 pounds (range of 10 to 60 pounds) per cow per day. There are no evident seasonal impacts on daily milk production in first and second lactation cows.
Figure 2. Average daily milk production per cow by lactation group over a 24-month period.

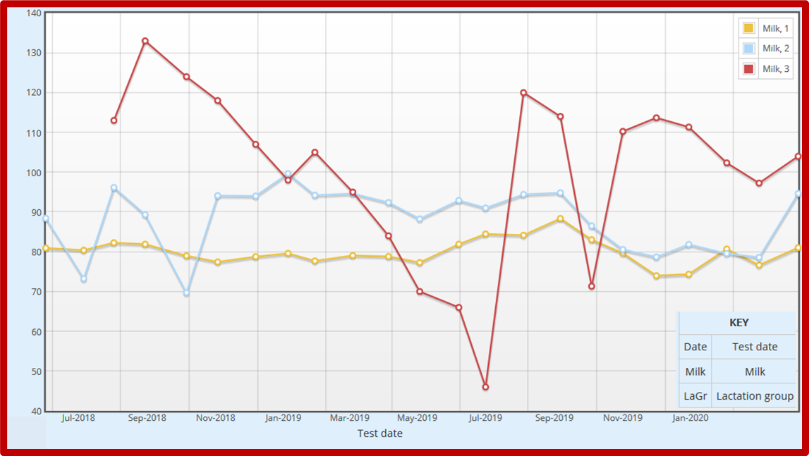
In Figure 2, a sharp depression in milk production in lactation group 3 is observed in July 2019. Compared to average daily milk production of February, milk production from March to July decreased about 30 pounds (range of 10 to 60 pounds) per cow per day.

There are no evident seasonal impacts on daily milk production in first and second lactation cows.

Fat Percent

Figure 3. Average percent fat by lactation group over a 24-month period. In figure 3, an arrow indicates a period where fat decreased in all lactation groups. Losses in all lactation groups were about 0.35 (range from 0.10-0.57) percentage points per month starting in June, continuing through September when compared to percent fat in May. Remember that milk fat varies depending on when (AM or PM) plant conduct monthly testing—fat is higher in the morning.
Figure 3. Average percent fat by lactation group over a 24-month period.

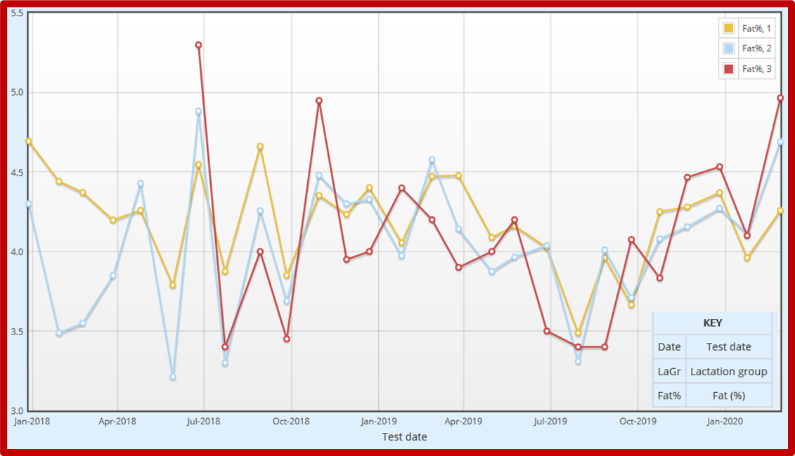
In Figure 3, an arrow indicates a period where fat decreased in all lactation groups. Losses in all lactation groups were about 0.35 (range from 0.10-0.57) percentage points per month starting in June, continuing through September when compared to percent fat in May. Remember that milk fat varies depending on when (AM or PM) plant conduct monthly testing—fat is higher in the morning.

Milk Quality

Figure 4. LSCC by lactation group over a 24-month period. In figure 4, there is an increase of LSCC between July and October 2018. LSCC peaks in August 2018. Between July and August there a one point decrease in LSCC.
Figure 4. LSCC by lactation group over a 24-month period.

In Figure 4, there is an increase of LSCC between July and October 2018. LSCC peaks in August 2018. Between July and August there a one-point decrease in LSCC.

Reproduction

Figure 5. Pregnancy risk or rate and conception rate over a 14-month period. In figure 5, pregnancy risk or pregnancy rate, which are used interchangeably throughout this factsheet, measures the percentage of eligible animals that become pregnant during a determined period of time.   There is a sharp decrease in pregnancy risk and conception rate in July 2019.
Figure 5. Pregnancy risk or rate and conception rate over a 14-month period.

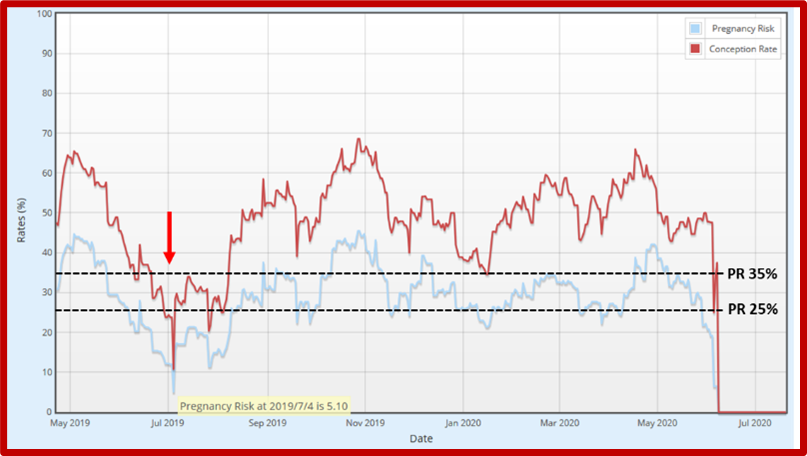
In Figure 5, pregnancy risk or pregnancy rate, which are used interchangeably throughout this factsheet, measures the percentage of eligible animals that become pregnant during a determined period of time. There is a sharp decrease in pregnancy risk and conception rate in July 2019.

Clinical Mastitis and Transition Cow Health

Figure 6. Health events over a 12-month period.
 Figure 6. Health events over a 12-month period.

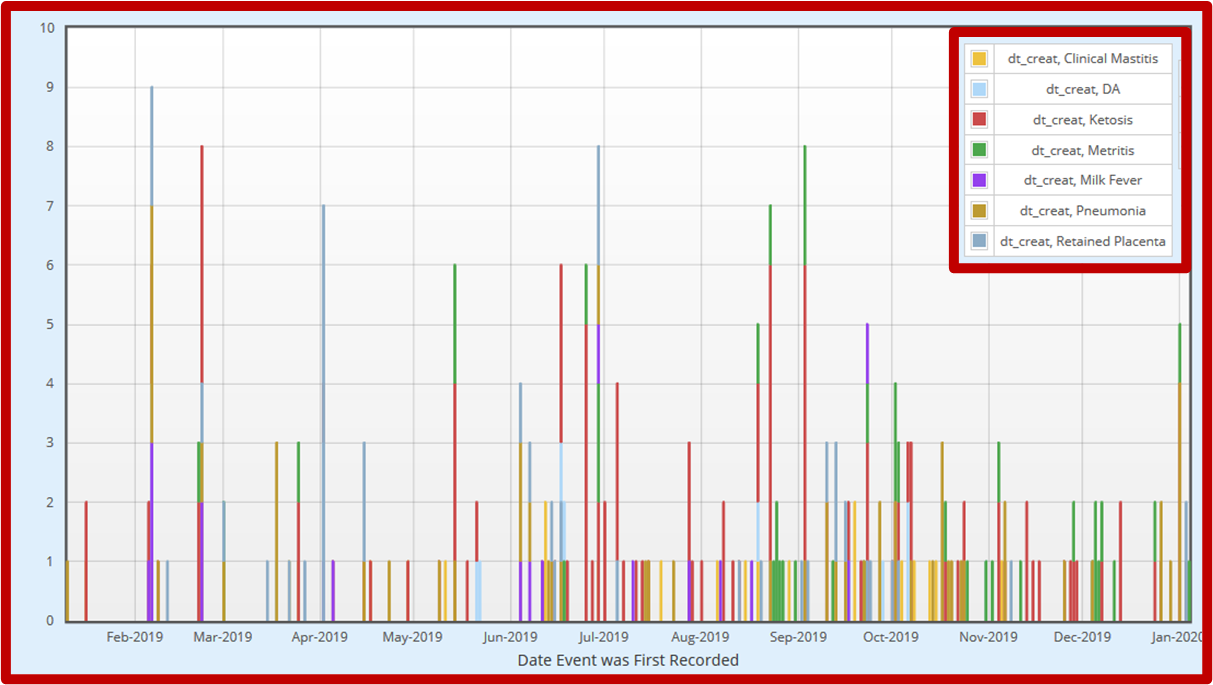
Figure 6 provides a visual picture of health events during the critical transition cow period over the last year. There is an increase of health event during the summer months.

Economic Impact

Economic impact of heat stress is large. By following the information extracted from the Herd Summary, it is possible to estimate the potential losses.

Assuming a marginal milk production of 2.4 pounds per pound of feed, the loss would be $0.15 per pound of milk not produced (at $0.20 per pound milk and $0.12 per pound of feed). A daily loss of 30 pounds per cow per day (Figure 2) equals to losses of $4.5 per cow per day during some summer months.

Considering a price of $2.8 per pound of fat, 0.35% milk fat depression (Figure 3) represents a reduced price received for milk sales of $0.98/cwt due to heat stress during warmer months.

A decrease of pregnancy risk or rate from 35 to 25% (Figure 5) would represent a loss of $7.90 per cow in the month of July compared to the month of May (https://dairymgt.info/markov/reader.php ↗️).

Take Home Messages

  • Use ME 305 to account for seasonal changes in milk production.
  • Milk fat content can vary depending on the time of day the plant tests (morning vs. afternoon).
  • Form a team to investigate seasonal depression in milk production. Involve your herd veterinarian, dairy consultants, nutritionists, and herd manager.
  • Assess the economic impact of heat stress on your herd to motivate actions and investments in mitigating its effects.

Authors


Carolina Pinzón-Sánchez

Bilingual Dairy Outreach Specialist – As a statewide Dairy Outreach Specialist, Carolina identifies needs and incorporates research findings into high-quality outreach education programs around dairy production.

Articles by Carolina Pinzón-Sánchez
Contact Carolina Pinzón-Sánchez


Victor Cabrera

Dairy Systems Management Extension Specialist, Professor, Honorary Associate/Fellow– Dr. Cabrera uses applied research, interdisciplinary approaches, and participatory methods to deliver practical, user-friendly, and scholarly decision support tools for dairy farm management aimed to improve dairy farm profitability, environmental stewardship, and long-term sustainability of the dairy farm industry.

Articles by Victor Cabrera
Contact Victor Cabrera


Original Authors

Dr. Maria Jose Fuenzalida, Theodore Halbach, and Lyssa Seefeldt.

Original publication date: July, 2020
Revised: April, 2025


RETURN TO TOP


Print This Page

Heat Stress

UW-Madison Division of Extension specialists and county educators provide information on best practices to prevent heat stress in both animals and humans. This article and video series provides tips to prepare for and manage the challenges of warm weather. See all articles and videos.

Heat Stess Videos

Latest Dairy Articles

  • ▶️ Watch: A Clearer Picture: Using Ultrasound to Detect Calf Respiratory Issues
  • Training Pays Off in the Parlor and Your Pocket
  • ▶️ Watch: From Field to Feed: What We Know about Feeding High Oleic Soybeans
  • ▶️ Watch: From Field to Feed: What We Know about Growing High Oleic Soybeans

You May Also Like

  • Using DHI Herd Summary Report to Assess Potential Impact of Heat Stress on a DairyUsing DHI Herd Summary Report to Assess Potential Impact of Heat Stress on a Dairy
  • Using DairyComp to Assess the Potential Impact of Heat Stress on a DairyUsing DairyComp to Assess the Potential Impact of Heat Stress on a Dairy
  • Troubleshooting Milk Fat Depression, Key Questions to AskTroubleshooting Milk Fat Depression, Key Questions to Ask
  • Using Bovisync Reports to Assess Potential Impact of Heat Stress on a Dairy - Coding SupplementUsing Bovisync Reports to Assess Potential Impact of Heat Stress on a Dairy - Coding Supplement

Division of Extension

Connecting people with the University of Wisconsin

  • Agriculture
  • Community Development
  • Health & Well-Being
  • Families & Finances
  • Natural Resources
  • Positive Youth Development

Agriculture at Extension

  • Agriculture Water Quality
  • Crops and Soils
  • Farm Management
  • Horticulture
  • Livestock

Questions?

Contact us at dairy@extension.wisc.edu

Dairy Newsletter

Stay up to date on the latest information and upcoming programs from Extension Dairy, sign up for our newsletter.

Sign up now.

University of Wisconsin-Madison      |        Explore Extension: Agriculture Community Development Families & Finances Health Natural Resources Youth
Connect With Us
Support Extension
Extension Home

We teach, learn, lead and serve, connecting people with the University of Wisconsin, and engaging with them in transforming lives and communities.

Explore Extension »

County Offices

Connect with your County Extension Office »

Map of Wisconsin counties
Staff Directory

Find an Extension employee in our staff directory »

staff directory
Social Media

Get the latest news and updates on Extension's work around the state

facebook iconFacebook

twitter icon Follow on X


Facebook
Follow on X

Feedback, questions or accessibility issues: info@extension.wisc.edu | © 2026 The Board of Regents of the University of Wisconsin System
Privacy Policy | Non-Discrimination Statement & How to File a Complaint | Disability Accommodation Requests

The University of Wisconsin–Madison Division of Extension provides equal opportunities in employment and programming in compliance with state and federal law.