Impact of Heat Stress
Dairy producers often find it challenging to measure the impact of heat stress on their operations. Analyzing dairy management records to identify seasonal trends is crucial for assessing potential losses related to heat stress. You don’t need to be an expert to explore a dairy’s herd management software and help producers quantify these losses. With a few simple calculations, you can also evaluate the profitability of investing in cow cooling measures.
How can you spot the telltale signs of heat stress in your records? Key indicators include reduced milk production, butterfat depression, declines in reproductive performance, increased cases of clinical and subclinical mastitis, and higher morbidity rates in transition cows.
In this fact sheet, we’ll provide sample commands and examples of data that can help you unlock valuable insights from your herd’s Dairy Comp records.

Milk Production
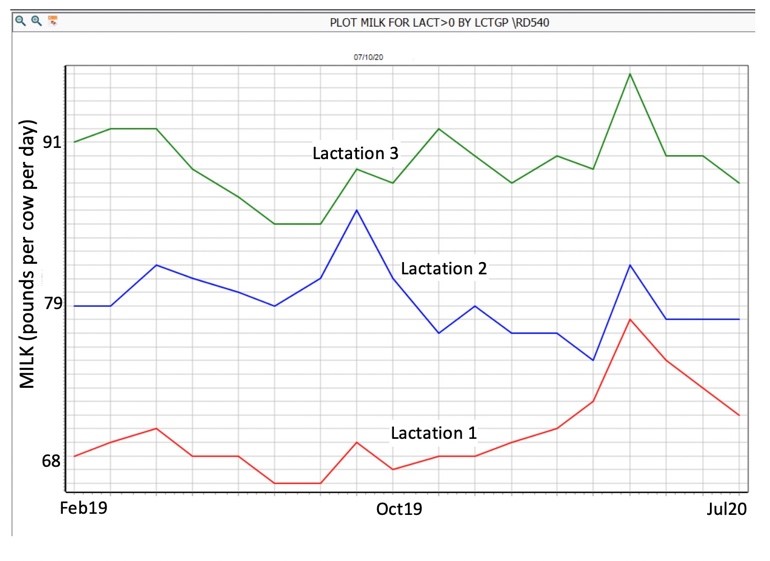
Figure 1 illustrates the average daily milk production per cow for first, second, and third lactation groups over the past 18 months. As shown, this herd experiences a seasonal decline in production starting in June, with the lowest levels observed in July and August across all lactation groups.
The herd, consisting of 921 lactating cows, averages 80 pounds of milk per cow per day during non-summer months. However, during June, July, and August, the average drops by 2 pounds to 78 pounds per cow per day.
Butterfat Percent
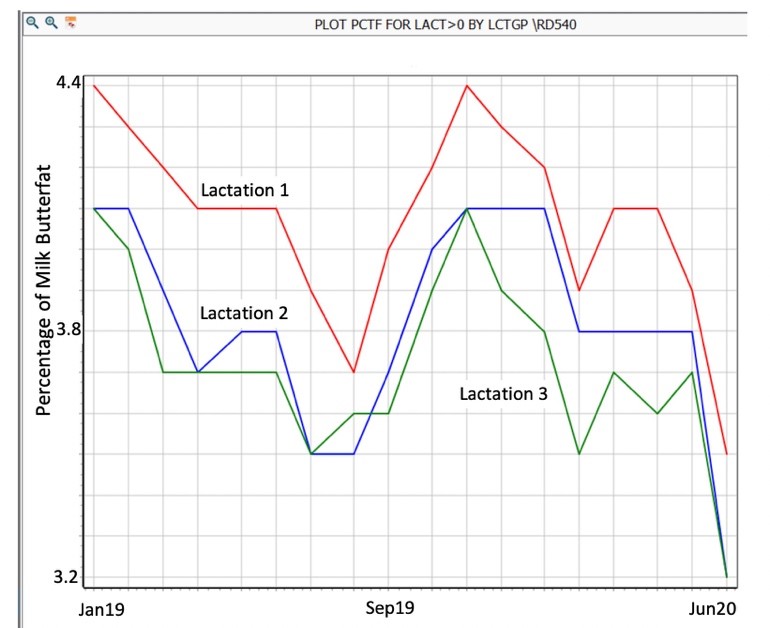
Figure 2 shows the average butterfat percentage per cow over the past 18 months. For this herd of 921 cows, the average butterfat percentage during non-summer months is 3.96%. However, during June, July, and August, it drops to 3.6%.
Reproduction
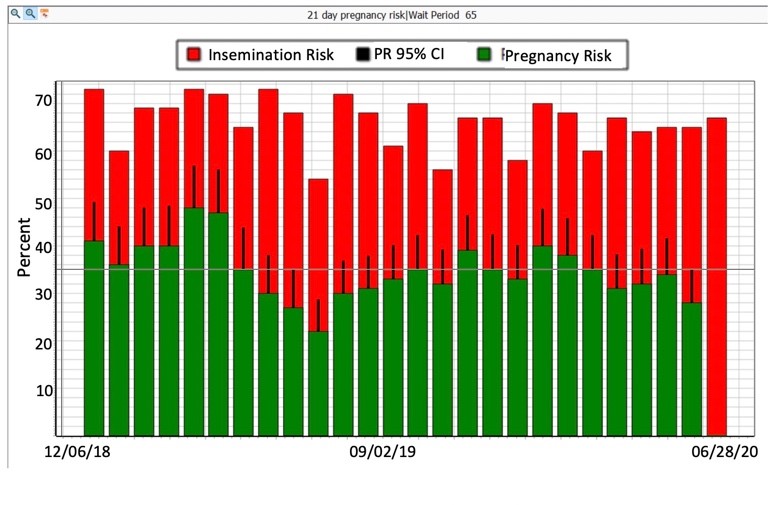
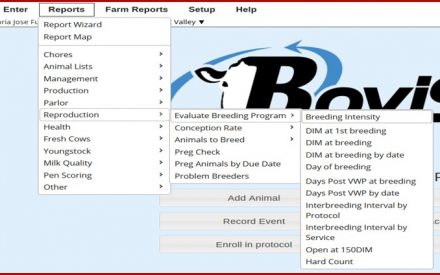
BREDSUM\EV65
The command in Figure 3 creates a graph showing the insemination risk in red and the pregnancy risk in blue over an 18-month period. The herd maintains a 36% 21-day pregnancy rate during the non-summer months. This drops to 27.5% in June, July, and August.
Milk Quality
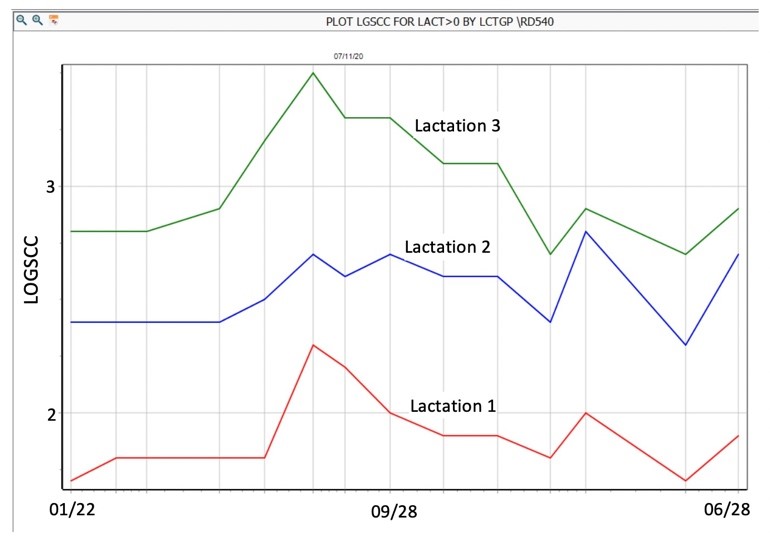
Figure 4 shows somatic cell count (SCC) log/linear score (LGSCC) trends over time. LGSCC converts somatic cell count to a log/linear score. For example, a LGSCC of 4 correlates to 200,000 cells per milliliter (cells/mL) SCC. There is a direct correlation between LGSCC with udder health and milk loss. In Figure 4, LGSCC elevates from a non-summer average of 2.3 to an average of 2.7 for June, July, and August.
One physiological effect of heat stress in dairy cows is reduced immune function, which can lead to higher somatic cell counts (SCC), as observed in this herd. It’s also common to see a delay between the onset of heat stress and the rise in SCC levels.
Clinical Mastitis and Transition Cow Health
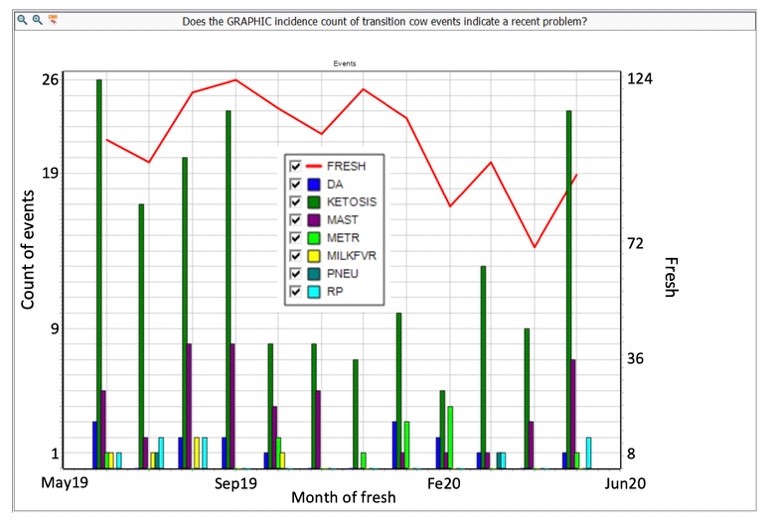
EGRAPH FRESH DA KETOSIS MAST METR MILKFVR PNEU RP FOR LACT>0 DIM<31 \FN1
Figure 5 illustrates health events during the critical transition cow period over the past year. In this herd, the average number of clinical mastitis cases is three per month. However, from June through September, this number doubles to six cases per month. Similarly, clinical ketosis follows a seasonal trend, increasing from an average of 10 cases per month to 21 during the summer.
Determining the Economic Losses
Impacts of heat stress during the summer months (90 days) for the example herd of 921 cows can be translated to the following economic losses:
- Assuming a marginal milk production of 2.4 pounds per pound of feed, the loss is 15 cents per pound of milk not produced (at 20 cents per pound of milk and 12 cents per pound of feed). A loss of 2 pounds per cow per day equals losses of $0.30 per cow per day. For our sample herd, the value lost during summer is 921 x 90 x
$0.30 = $24,867. - Considering a price of $2.8 per pound of fat, 0.36% milkfat depression represents a reduced milk price of
$1.008 per hundredweight (cwt.) due to heat stress. For the milk quantity side of the equation, multiply the herd’s summer production of 78 pounds per cow x 921 cows x 90 days/100 = 64,650 cwt. of milk produced in summer.
To get the total loss resulting from milkfat depression, multiply summer production by the reduction in milk price. For this herd, the calculation is 64,650 cwt. x 1.008 per cwt. = $65,167. - A drop in pregnancy rate from 36% to 27.5% represents a loss of $18.23 per cow during summer months (https://dairymgt.info: Dairy Reproductive Economic Analysis). The impact of reduced herd reproductive performance is determined by multiplying 921 x $18.23 = $16,790.
- A rise of LGSCC from 2.3 to 2.7 equates to approximately 20.9 pounds per cow of less production or $3.12 in losses per cow during summer. For this herd, lost revenue due to increased SCC is calculated by multiplying 921 x $3.12 = $2,874.
- Considering each case of clinical mastitis at a cost of
$286, 9 more cases during summer account for losses of
$2,574. - Considering each case of ketosis at a cost of $129; 33 more cases during summer equals to losses of $4,257.
Summary
Heat stress causes losses that cost the U.S. dairy industry an estimated $1.5 billion annually. For the farm analyzed in this article, losses due to heat stress totaled $116,529. Knowing this information allows the producer to invest in appropriate heat stress mitigation measures that can contribute directly to the dairy’s bottom line.
DairyComp Commands used:
| To identify | DairyComp Command |
|---|---|
| Reduced milk production | PLOT MILK FOR LACT>0 BY LCTGP\RD540 |
| Butterfat depression | PLOT PCTF FOR LACT>0 BY LCTGP\RD540 |
| Reproduction Performance decline | BREDSUM\EV65 |
| Increases in clinical and sub-clinical mastitis | PLOT LGSCC FOR LACT>0 BY LCTGP\RD540 |
| Increased morbidity in transition cows | EGRAPH FRESH DA KETOSIS MAST METR MILKFVR PNEU RP FOR LACT>0 DIM<31 \FN1 |
Authors

Carolina Pinzón-Sánchez
Bilingual Dairy Outreach Specialist – As a statewide Dairy Outreach Specialist, Carolina identifies needs and incorporates research findings into high-quality outreach education programs around dairy production.

Victor Cabrera
Dairy Systems Management Extension Specialist, Professor, Honorary Associate/Fellow– Dr. Cabrera uses applied research, interdisciplinary approaches, and participatory methods to deliver practical, user-friendly, and scholarly decision support tools for dairy farm management aimed to improve dairy farm profitability, environmental stewardship, and long-term sustainability of the dairy farm industry.
Original Authors
Theodore Halbach, Dr. Victor Cabrera, Maria Fuenzalida Valenzuela, Lyssa Seefeldt and Craig Walters, VAS.
Original publication date: August 6, 2020
Revised: April 1, 2025